Node Exporter Quickstart and Dashboard
31,414 3.8 (9 reviews)

Created 2/26/2021
Updated 4/25/2022
Revision 2
Grafana Version >=7.4.3

To use this dashboard, please use the following Node Exporter Quickstart to monitor your Linux nodes by setting up Prometheus Node Exporter with preconfigured dashboards, alerting rules, and recording rules.
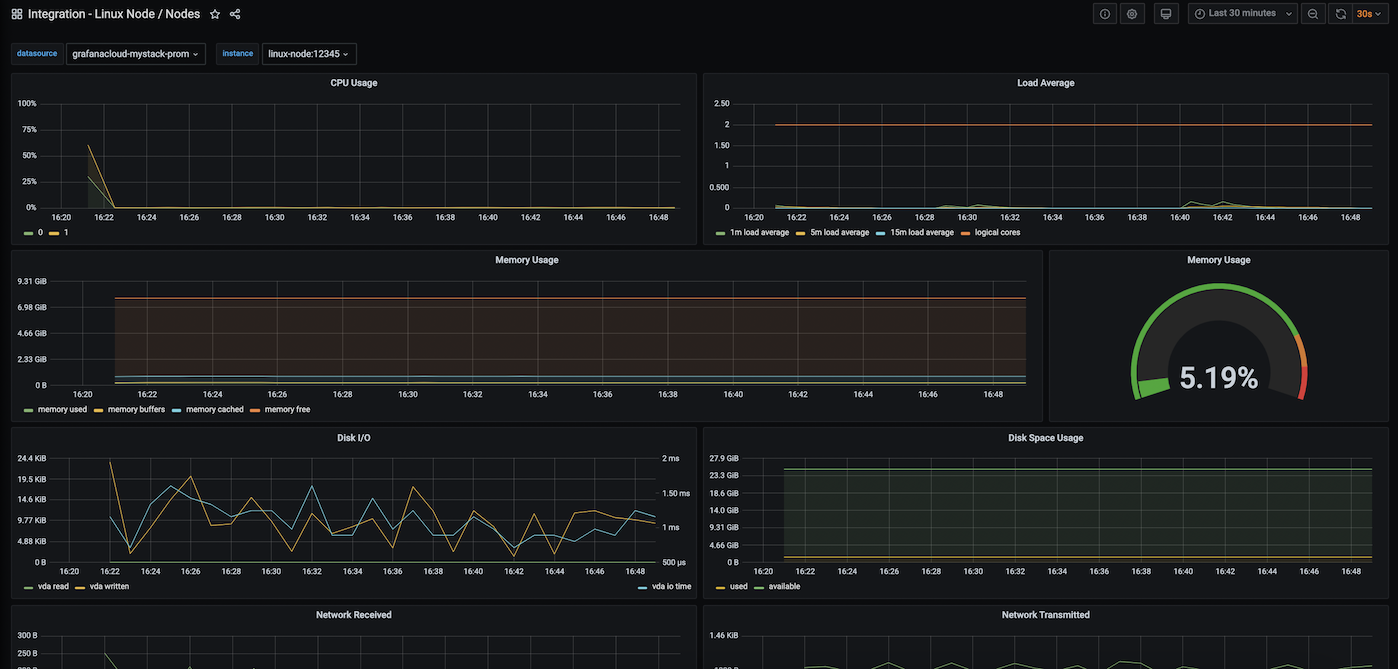

This dashboard includes panels for the following metrics:

  • CPU Usage
  • Load Average
  • Memory Usage
  • Disk I/O
  • Disk Usage
  • Network Received
  • Network Transmitted

This dashboard was generated using the Node-exporter mixin. It uses the job=node selector to query metrics. If you need to use a different job selector, modify the selector in config.libsonnet and regenerate the dashboard following the instructions in the mixin repository.

You need to import several Prometheus recording rules before using this dashboard. To learn more, please see the Node Exporter guide

Get Dashboard
Download
Copy to Clipboard
Source Grafana.com