Node exporter: mdadm status 932932
8/4/2020
8/4/2020
1
Host Metrics
>=7.0.2
Prometheus
Description
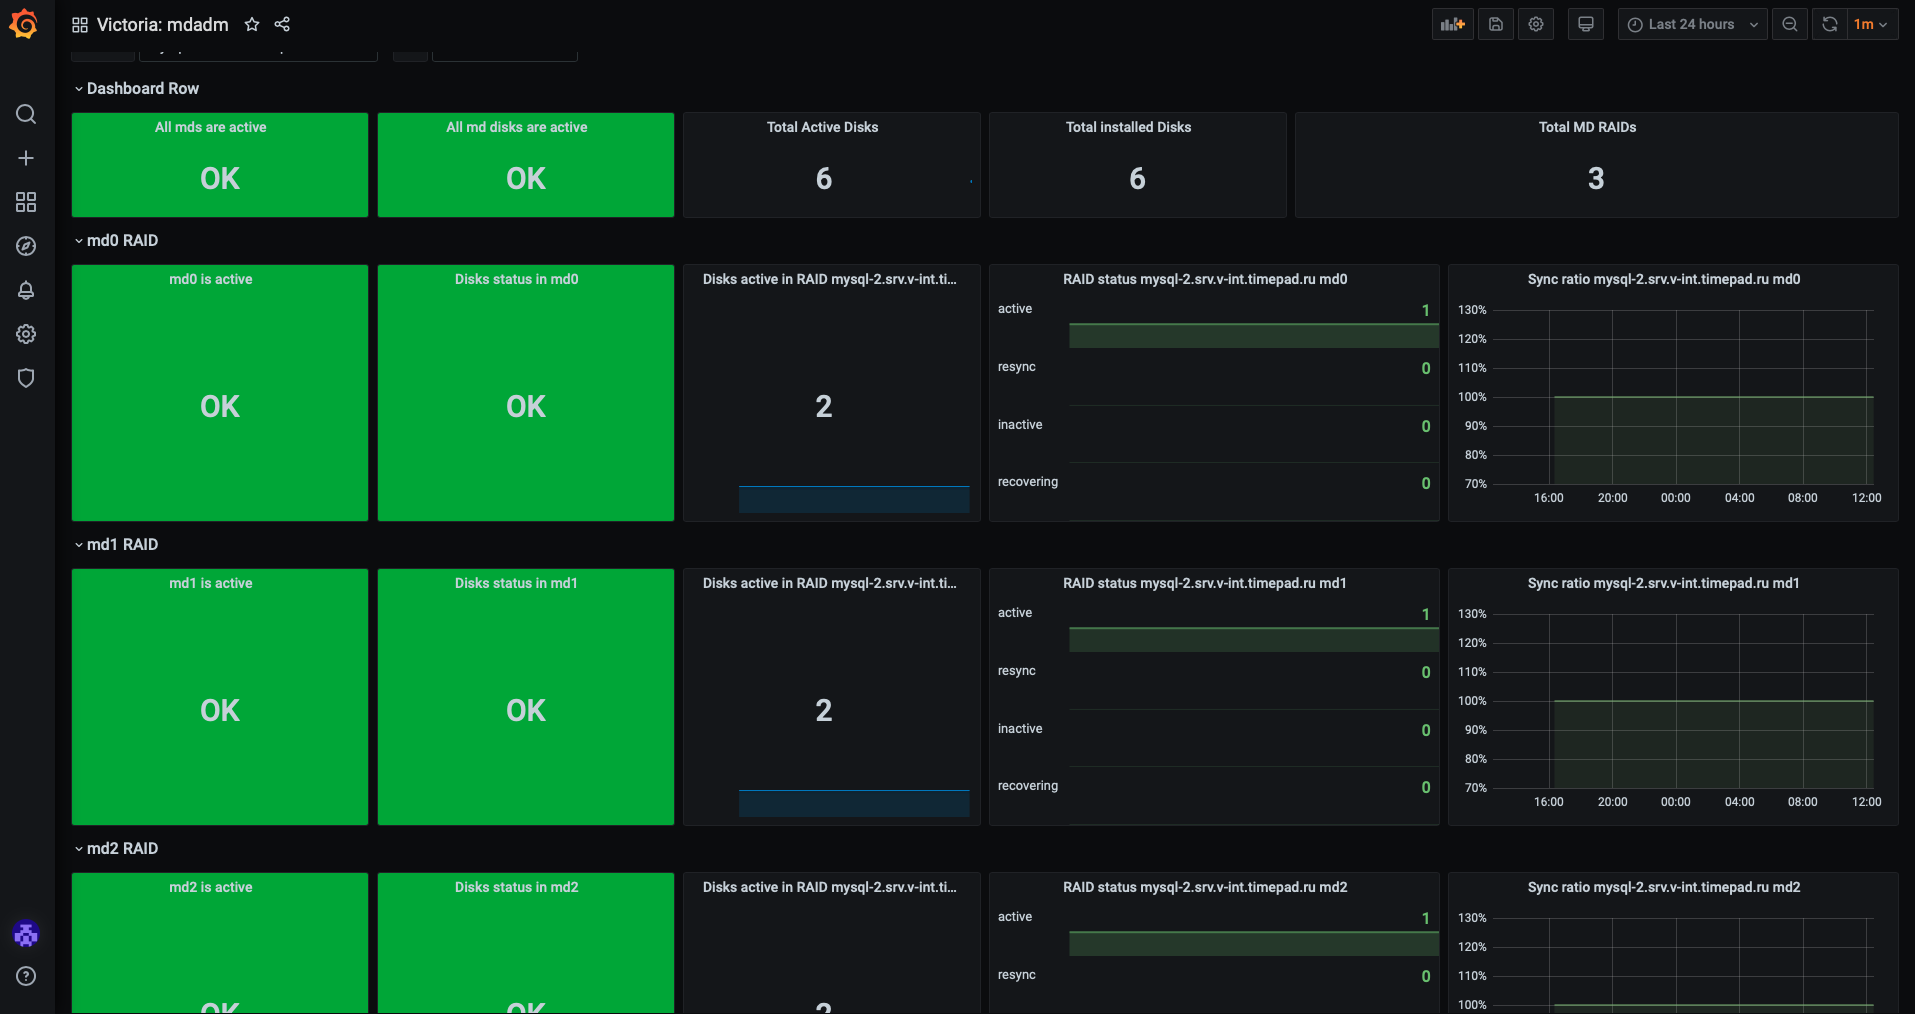
Prometheus node_exporter mdadm module dashboard. Per Server and per md view
Screenshots
Used Metrics 44
node_md_blocks
node_md_blocks_synced
node_md_disks
node_md_state
Get Dashboard✕
Download
Copy to Clipboard