Node Exporter Full with Node Name 42,44442,444 5.0 (6 reviews)
5/22/2019
5/22/2019
1
Host Metrics
>=v4.4.3
Prometheus
Description
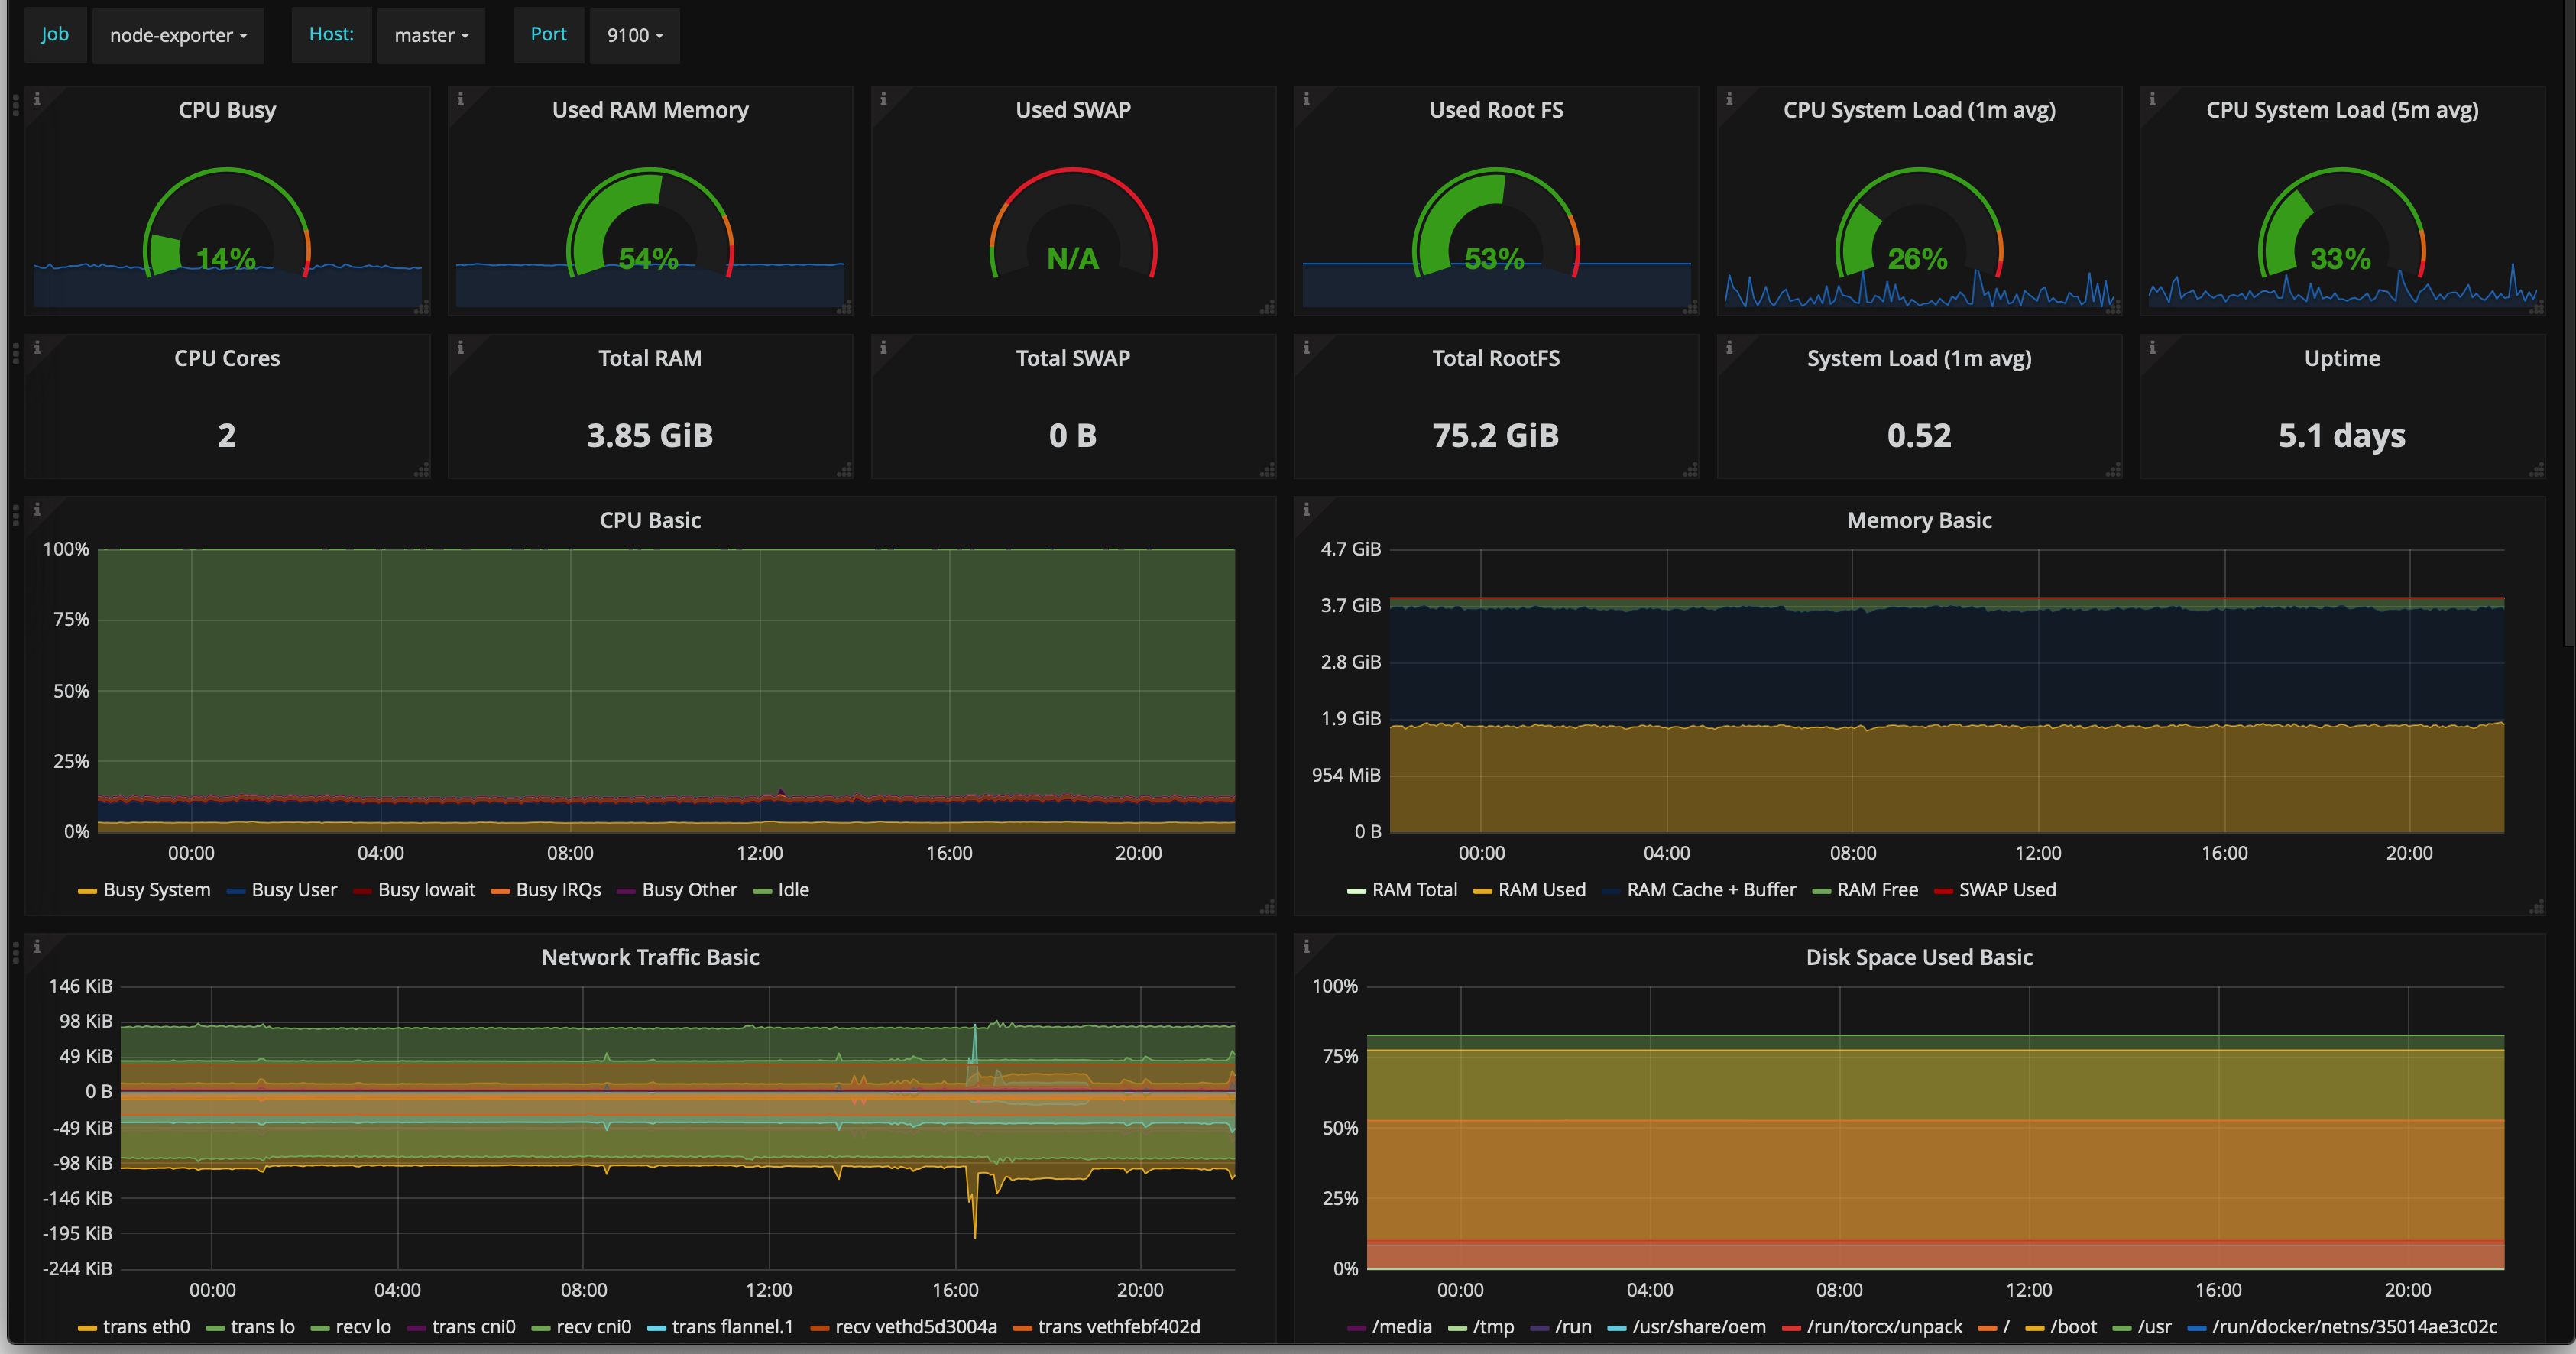
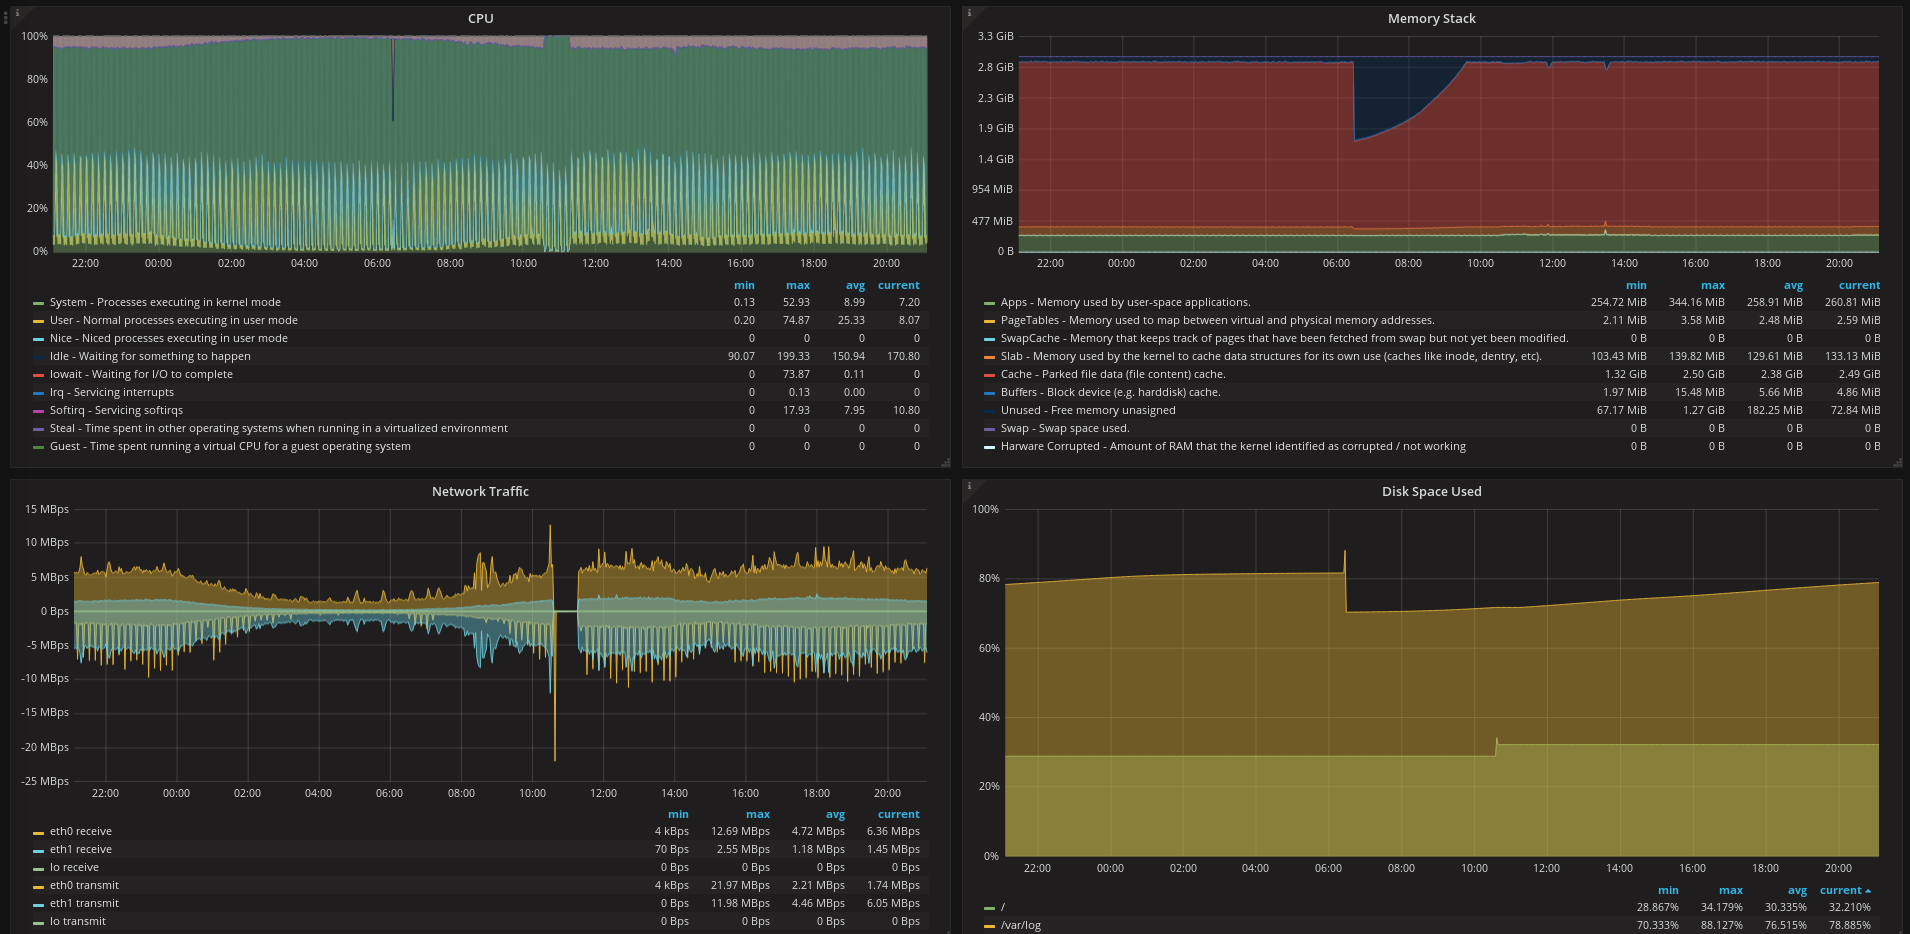
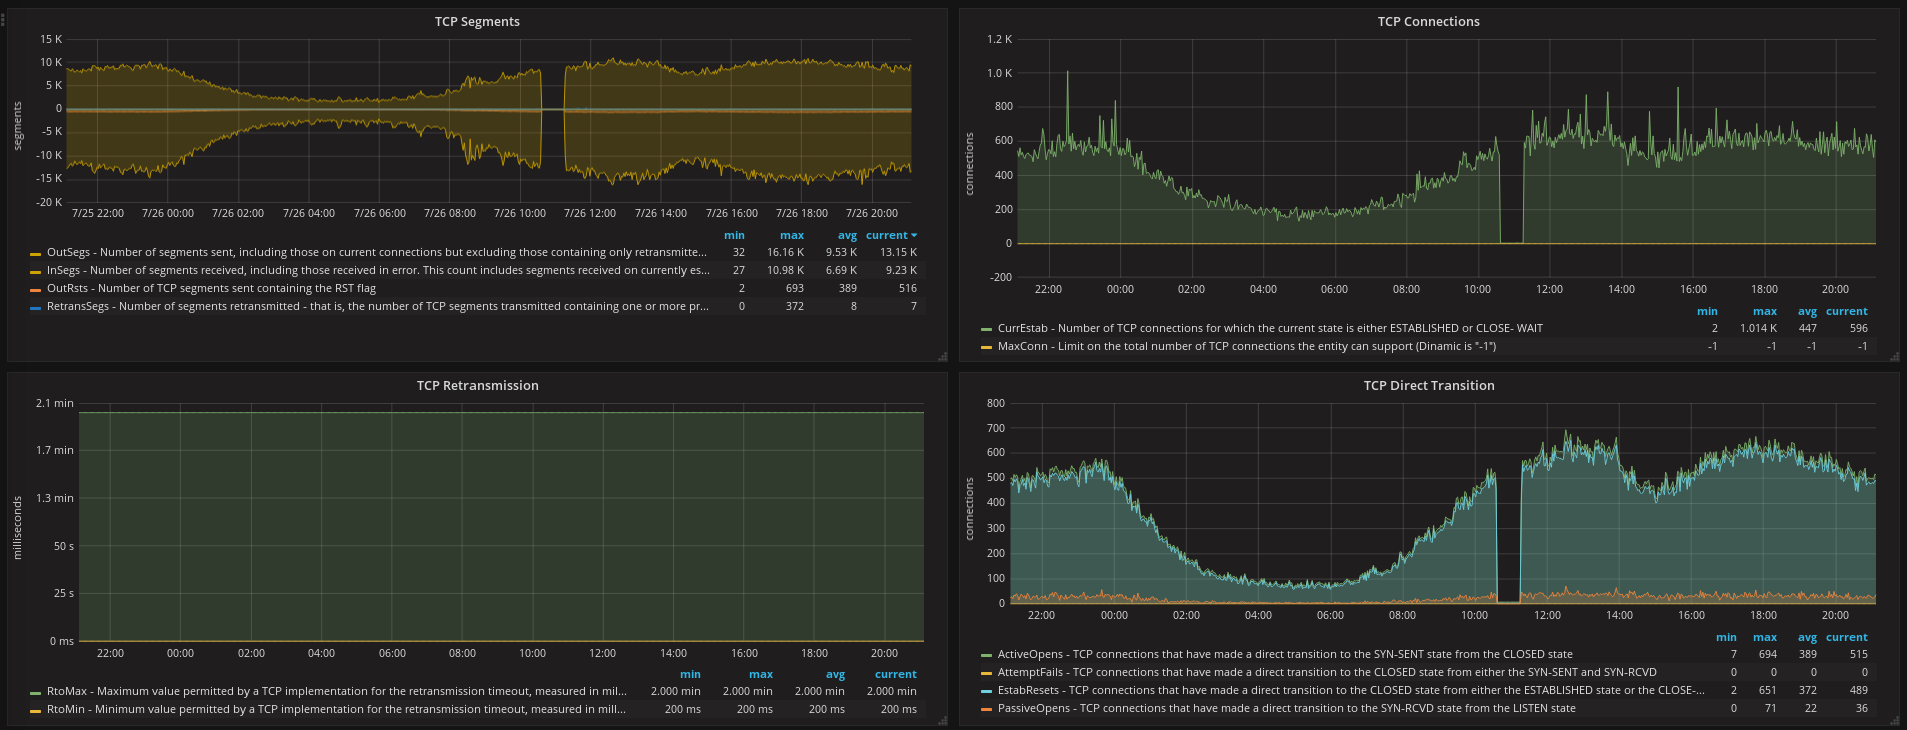
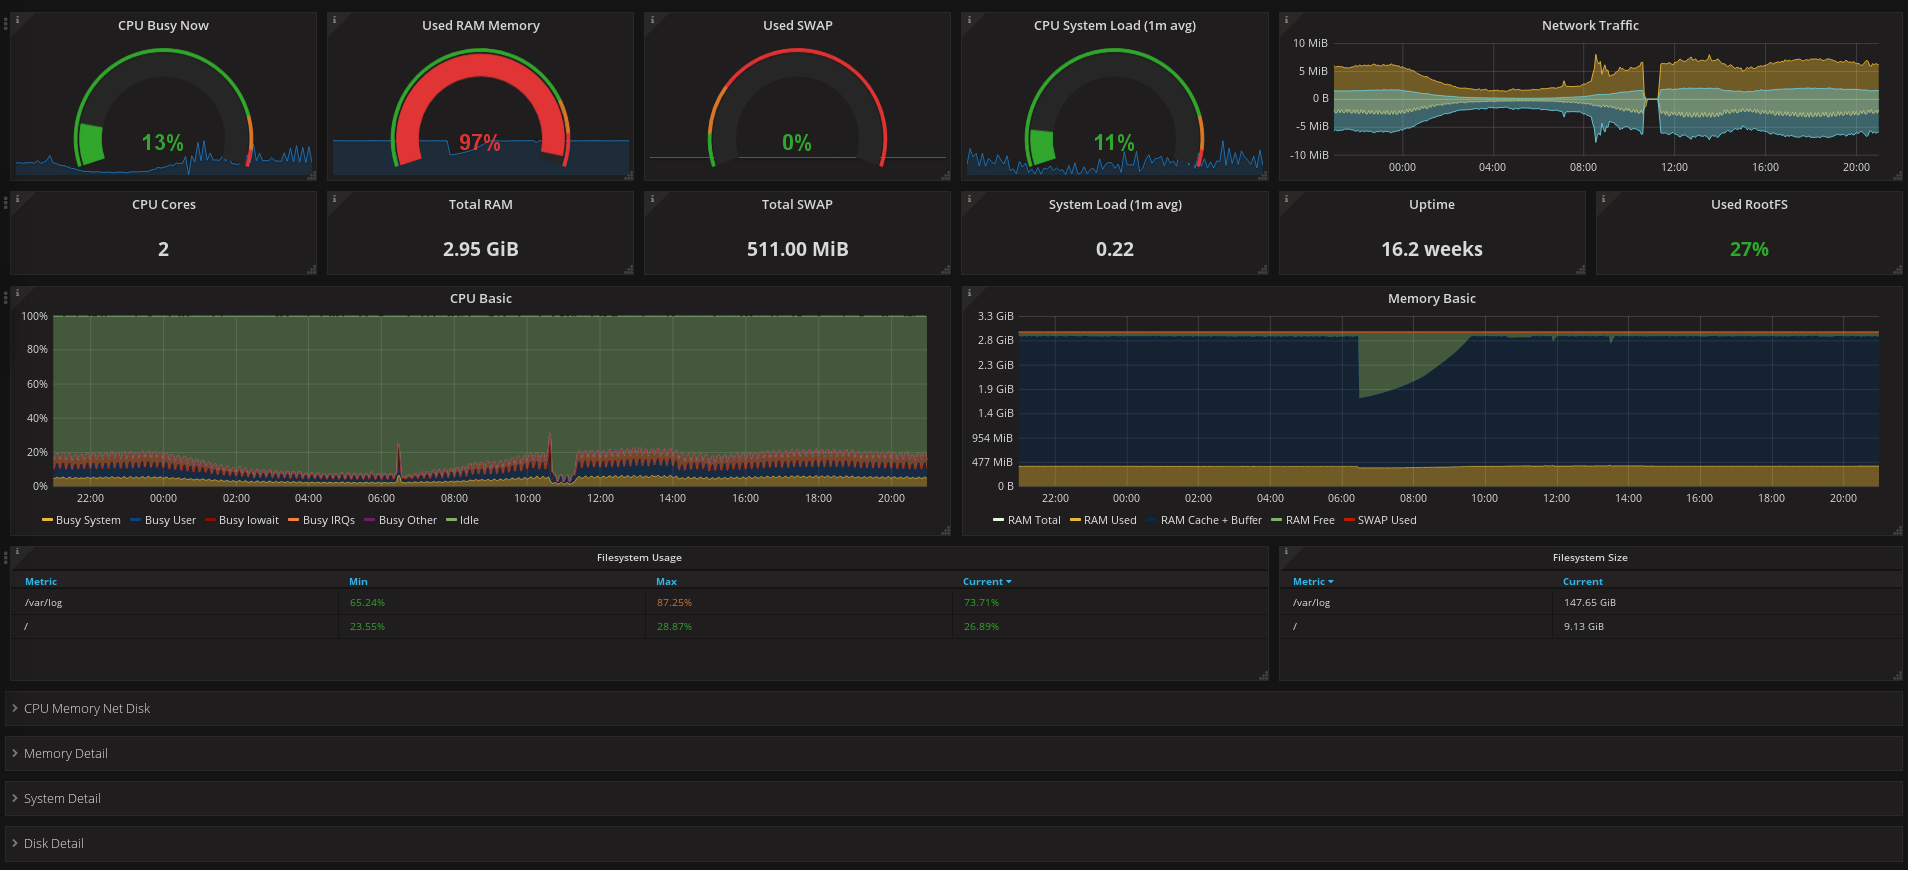
This dashboard monitors per-node system health and resource usage using data from node_exporter. It centers on essential metrics like node_cpu_seconds_total, node_memory_bytes, and node_load1 to visualize CPU utilization, memory consumption, and short-term load. Key features include per-node breakdowns, alert-ready panels, and consolidated views of disk I/O and network activity to quickly identify hotspots across hosts.
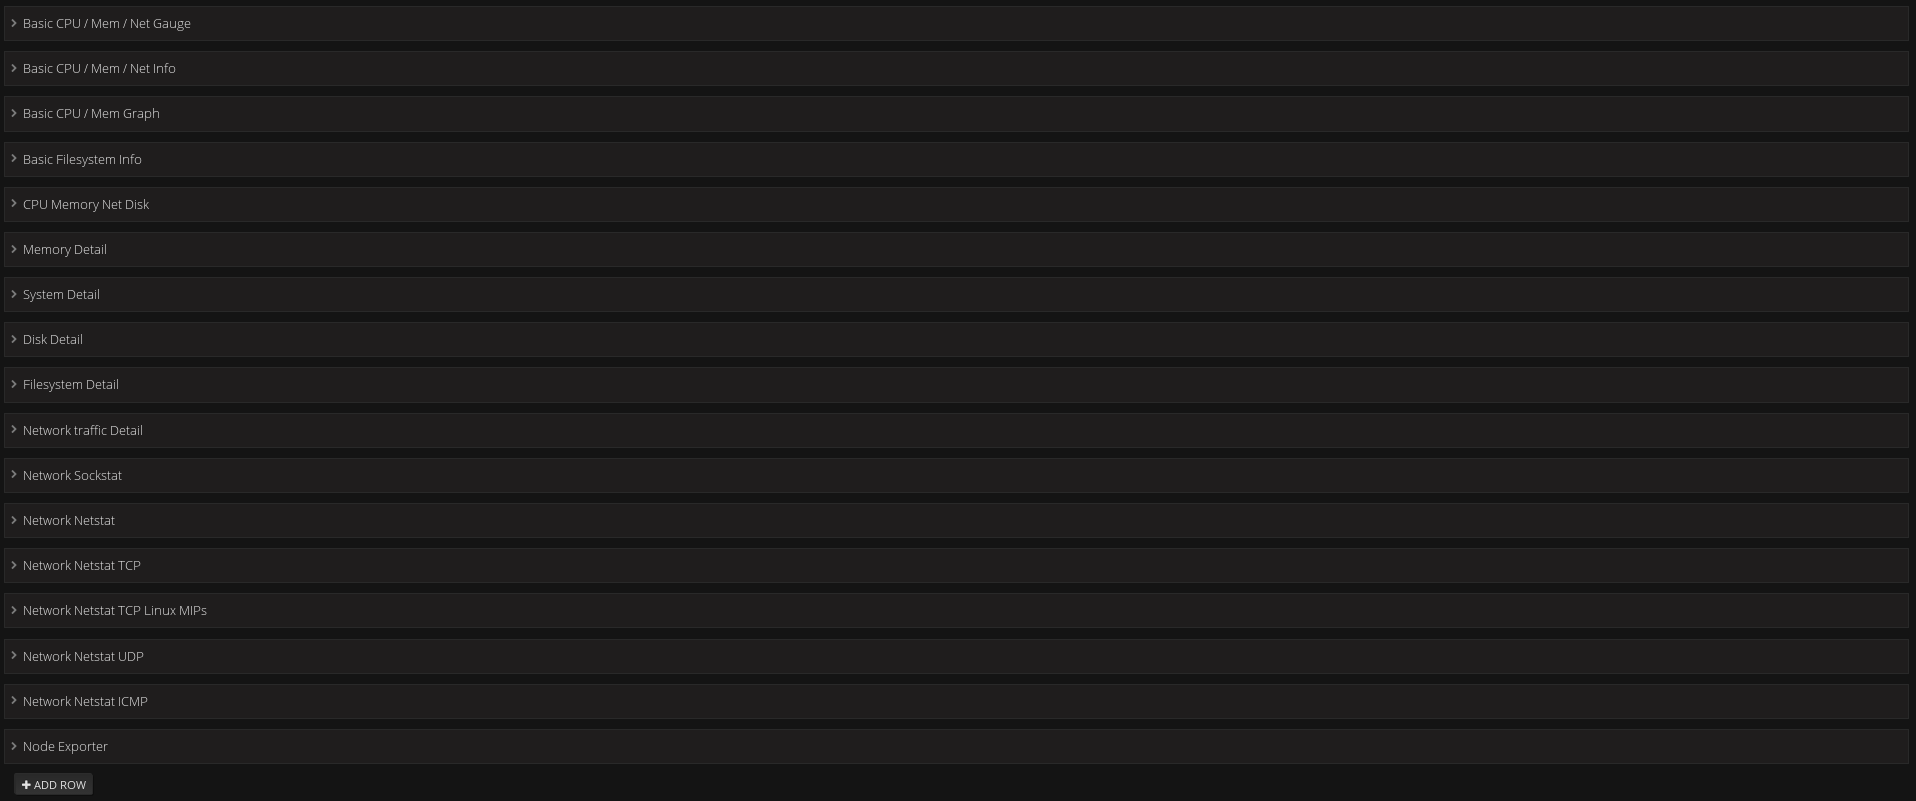
Screenshots
Get Dashboard✕
Download
Copy to Clipboard