Node Exporter Full 0.15 1,5221,522
7/18/2018
12/5/2018
3
>=5.2.1
Prometheus
Description
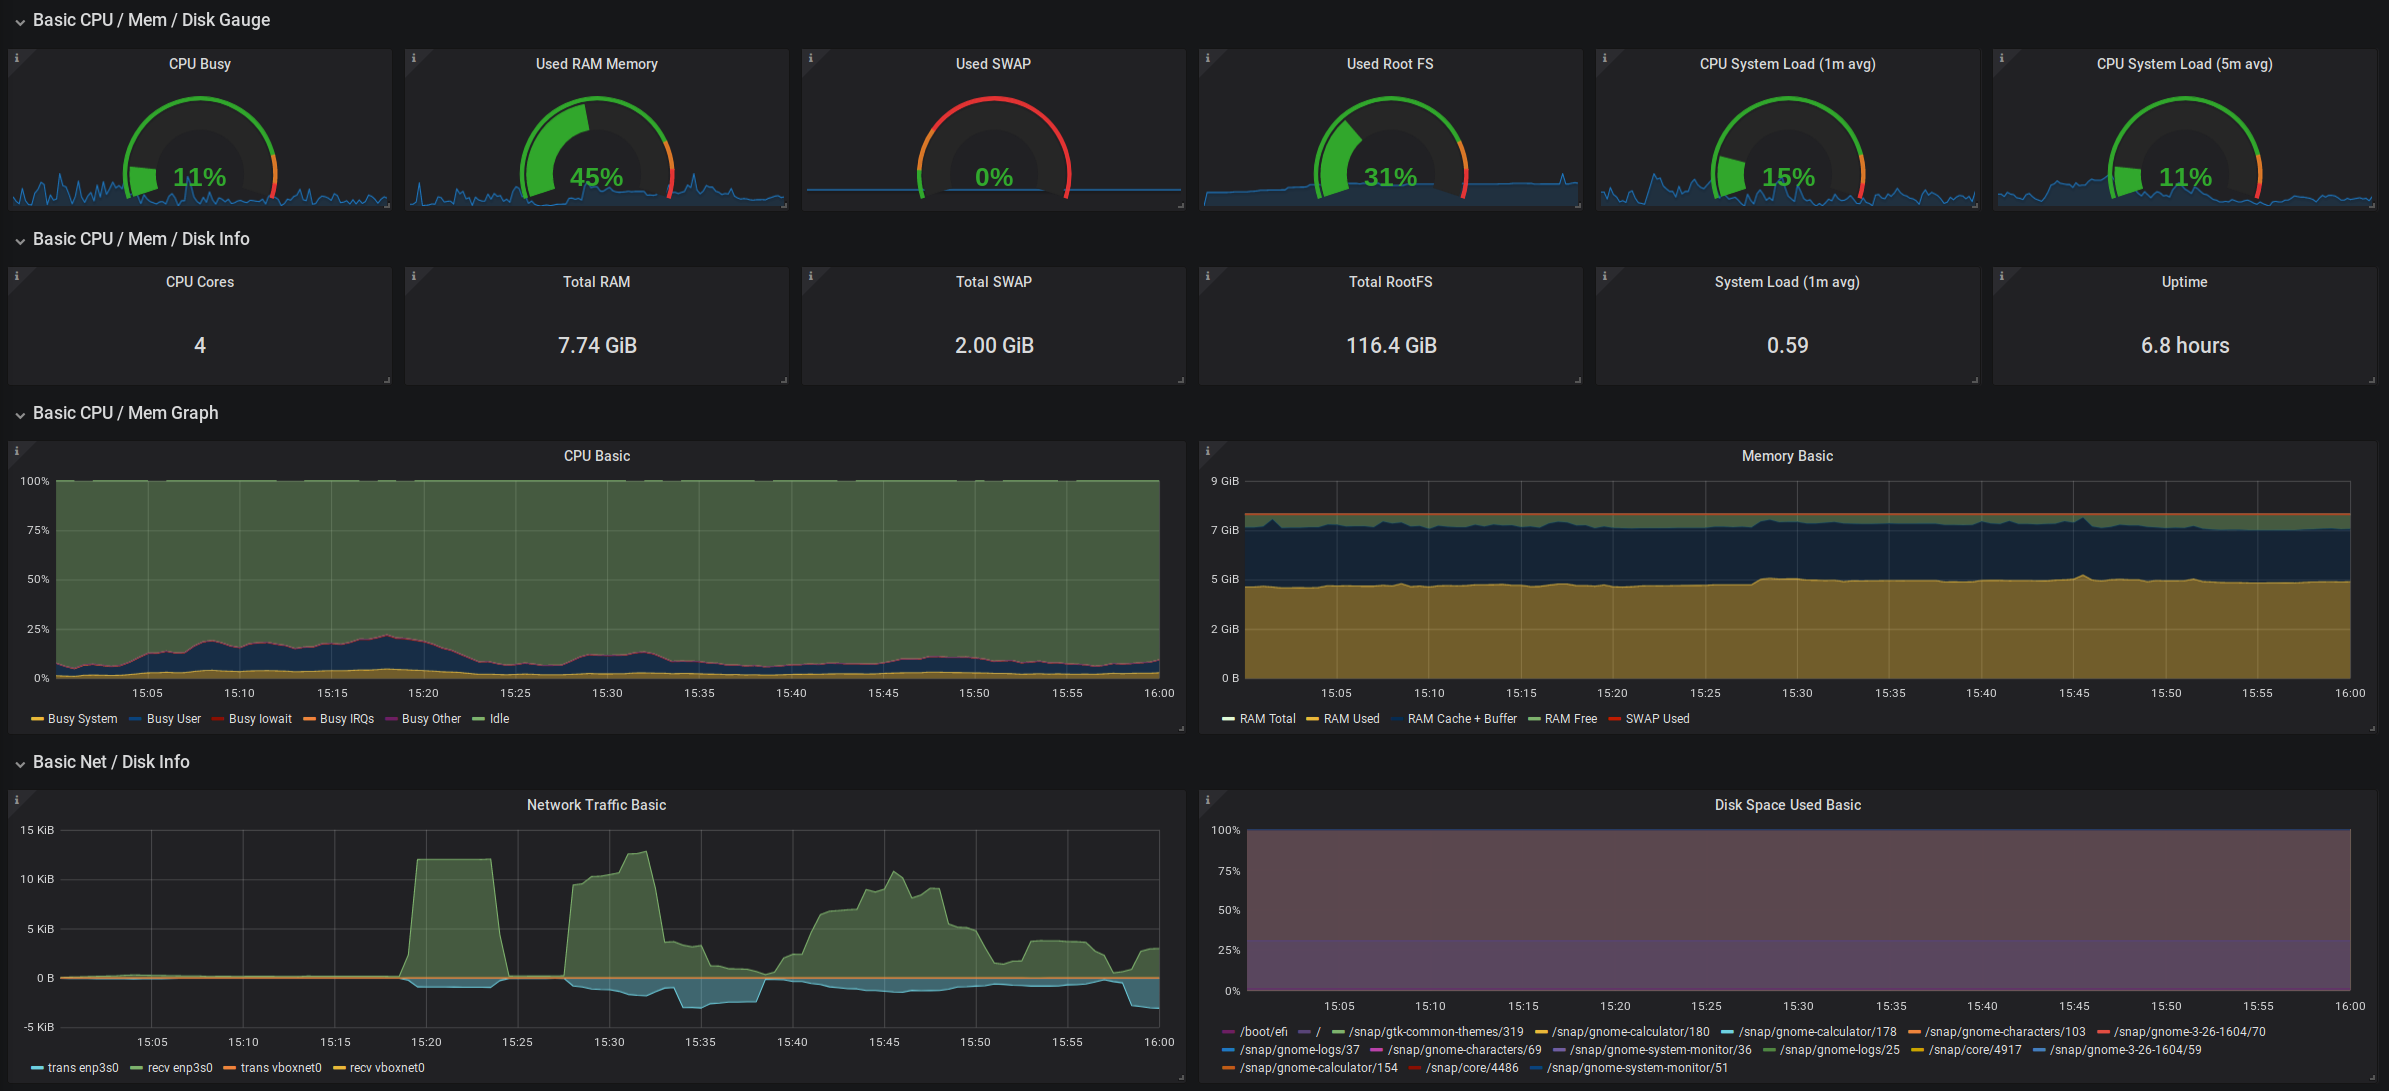
Updated metrics name, to comply with Prometheus2.1 Dashboard from https://github.com/rfrail3/grafana-dashboards with updated metrics names for Node Exporter 0.15 version. In templating changed metric name to find hosts.
Screenshots
Used Metrics 1616
node_boot_time
node_cpu
node_filesystem_avail
node_filesystem_size
-
node_load1
-
node_load5
node_memory_Buffers
node_memory_Cached
node_memory_MemAvailable
node_memory_MemFree
node_memory_MemTotal
node_memory_SwapFree
node_memory_SwapTotal
node_network_receive_bytes
node_network_transmit_bytes
node_time
Get Dashboard✕
Download
Copy to Clipboard