Node Exporter for Prometheus Dashboard EN 20201010 829829
Description
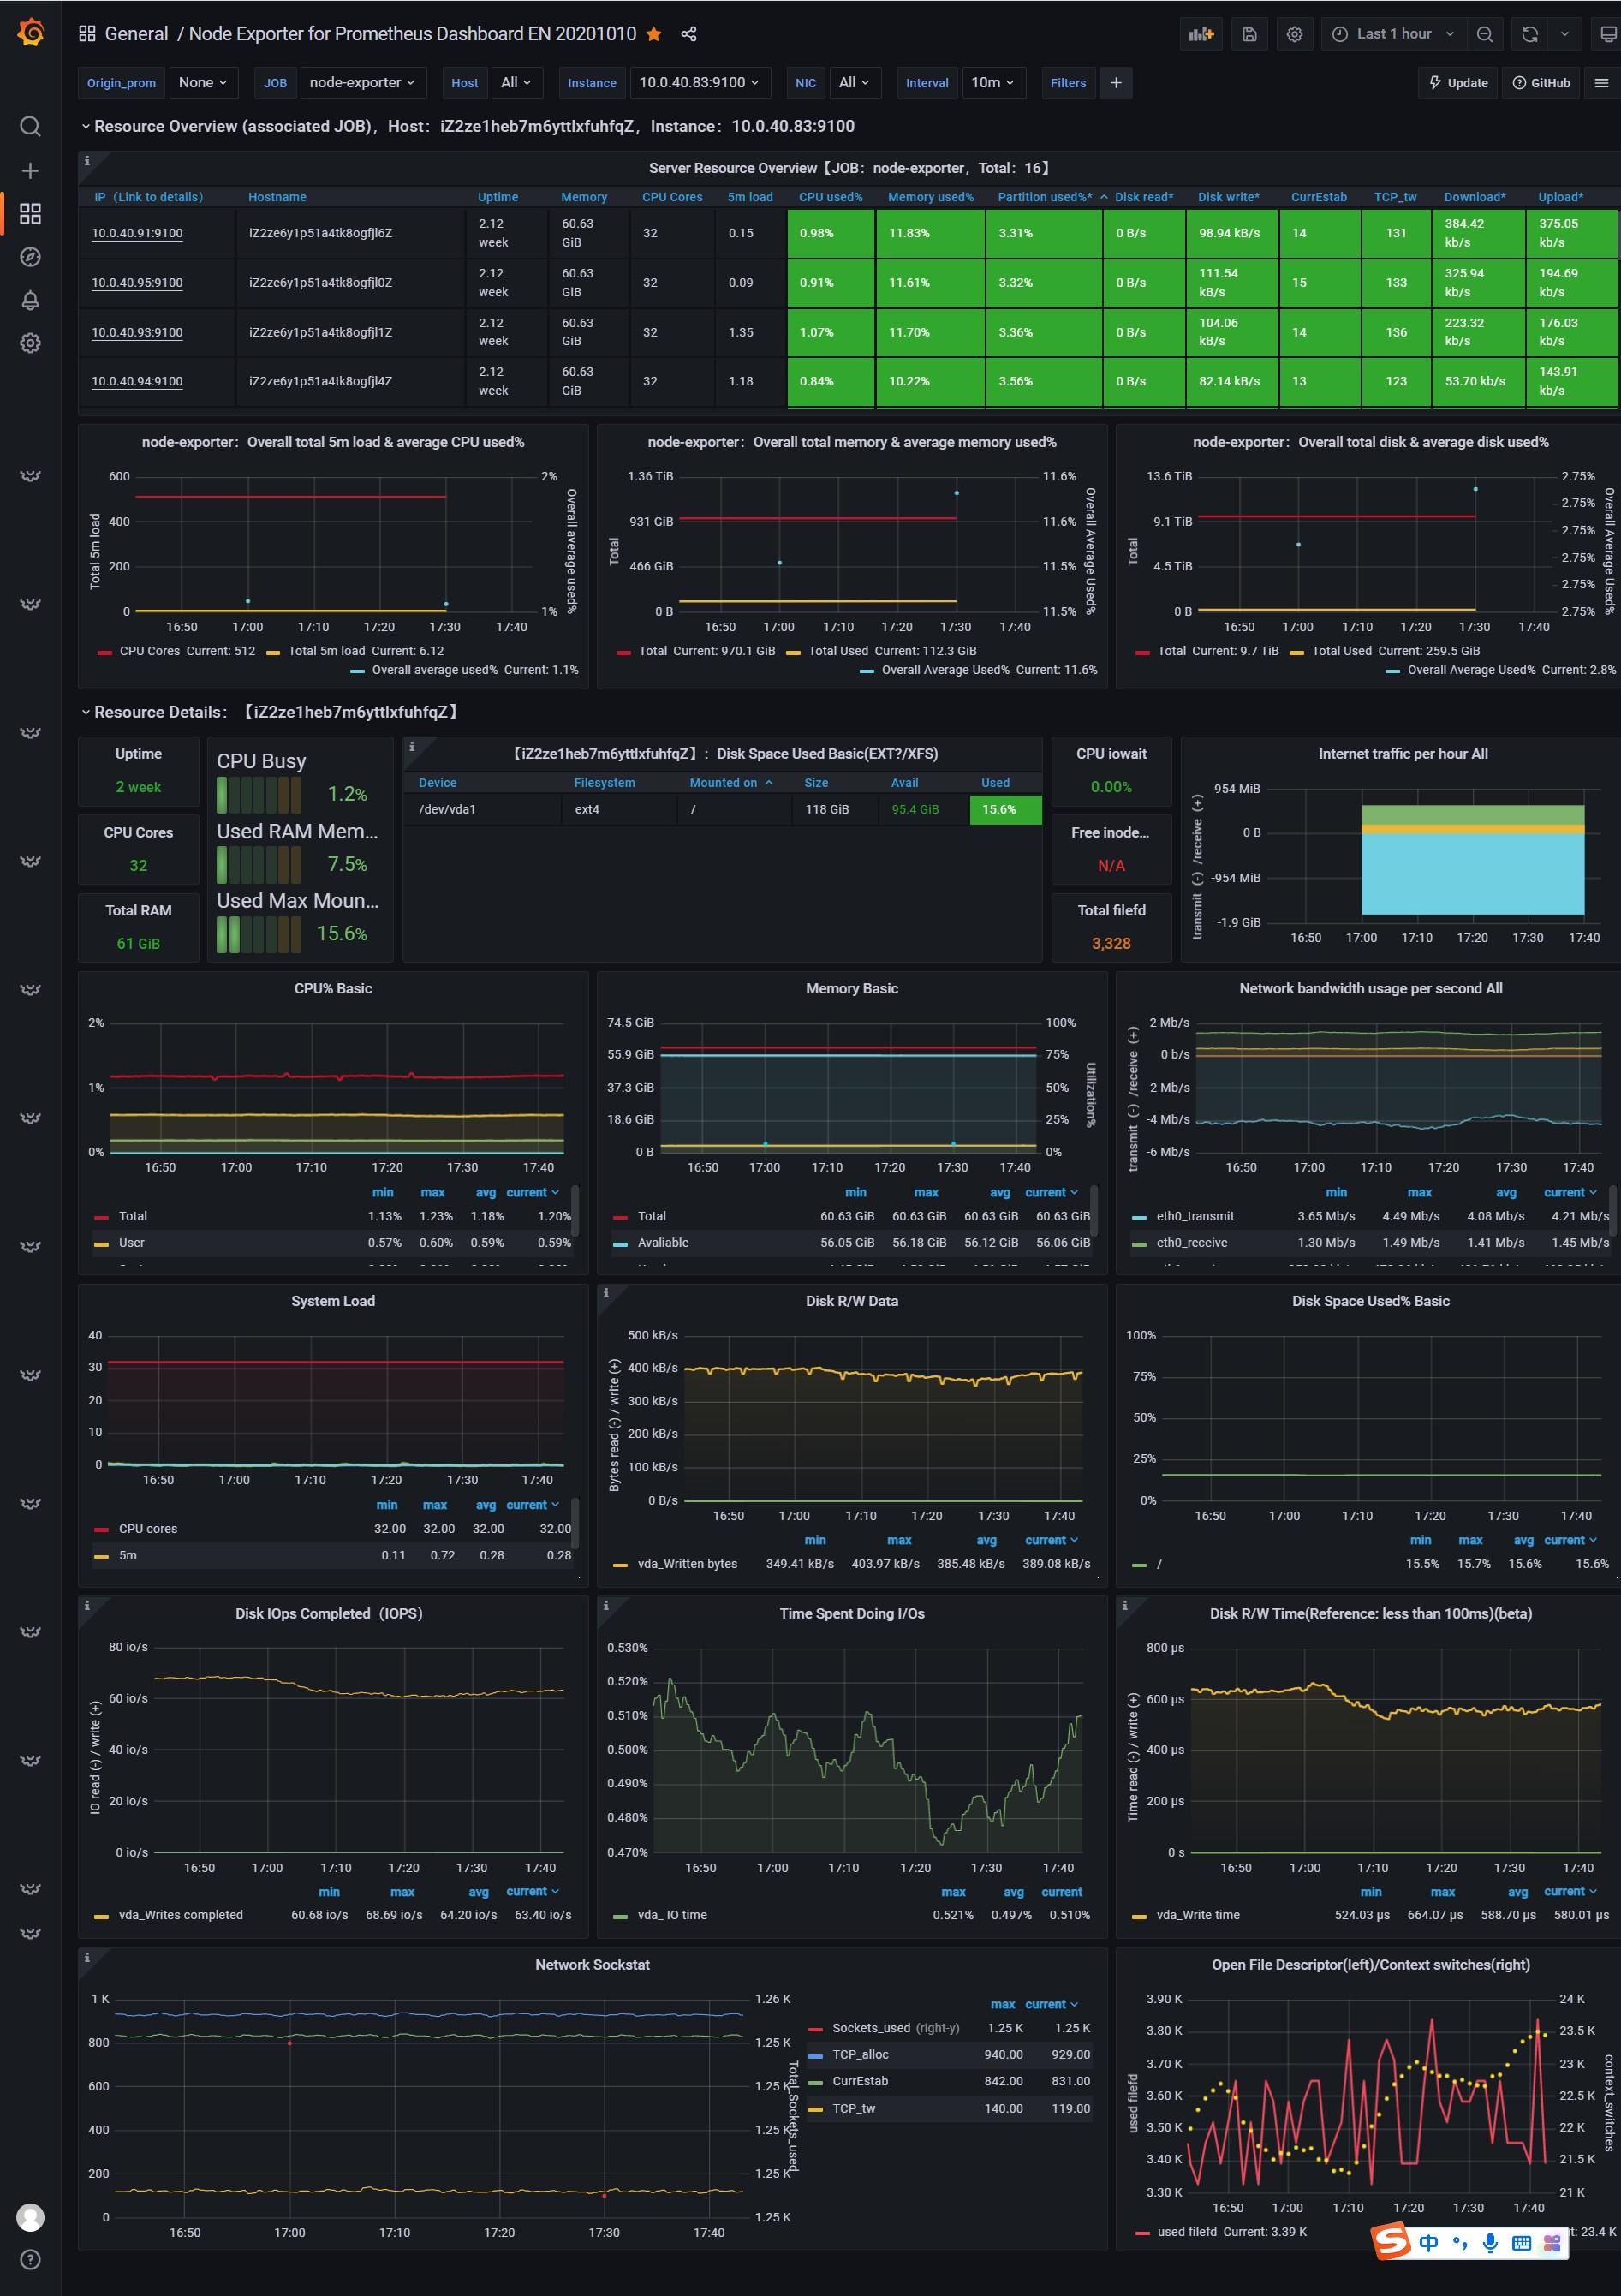
【English version】Update 2020.10.10, add the overall resource overview! Support Grafana6&7,Support Node Exporter v0.16 and above.Optimize the main metrics display. Includes: CPU, memory, disk IO, network, temperature and other monitoring metrics。https://github.com/starsliao/Prometheus
Screenshots
Used Metrics 4444
interval
-
node_boot_time_seconds
-
node_context_switches_total
-
node_cpu_seconds_total
-
node_disk_io_now
-
node_disk_io_time_seconds_total
-
node_disk_io_time_weighted_seconds_total
-
node_disk_read_bytes_total
-
node_disk_read_time_seconds_total
-
node_disk_reads_completed_total
-
node_disk_write_time_seconds_total
-
node_disk_writes_completed_total
-
node_disk_written_bytes_total
-
node_filefd_allocated
-
node_filefd_maximum
-
node_filesystem_avail_bytes
-
node_filesystem_files
-
node_filesystem_files_free
-
node_filesystem_free_bytes
-
node_filesystem_size_bytes
-
node_load1
-
node_load15
-
node_load5
-
node_memory_Buffers_bytes
-
node_memory_Cached_bytes
-
node_memory_MemAvailable_bytes
-
node_memory_MemFree_bytes
-
node_memory_MemTotal_bytes
-
node_memory_SwapFree_bytes
-
node_memory_SwapTotal_bytes
-
node_netstat_TcpExt_ListenDrops
-
node_netstat_Tcp_ActiveOpens
-
node_netstat_Tcp_CurrEstab
-
node_netstat_Tcp_InSegs
-
node_netstat_Tcp_OutSegs
-
node_netstat_Tcp_PassiveOpens
-
node_netstat_Tcp_RetransSegs
-
node_network_receive_bytes_total
-
node_network_transmit_bytes_total
-
node_sockstat_TCP_alloc
-
node_sockstat_TCP_tw
-
node_sockstat_UDP_inuse
-
node_sockstat_sockets_used
-
node_uname_info