Node Exporter for Prometheus Dashboard based on 11074 678,213678,213 5.0 (5 reviews)
10/30/2021
11/28/2021
6
Host Metrics
>=8.2.2
Prometheus
Description
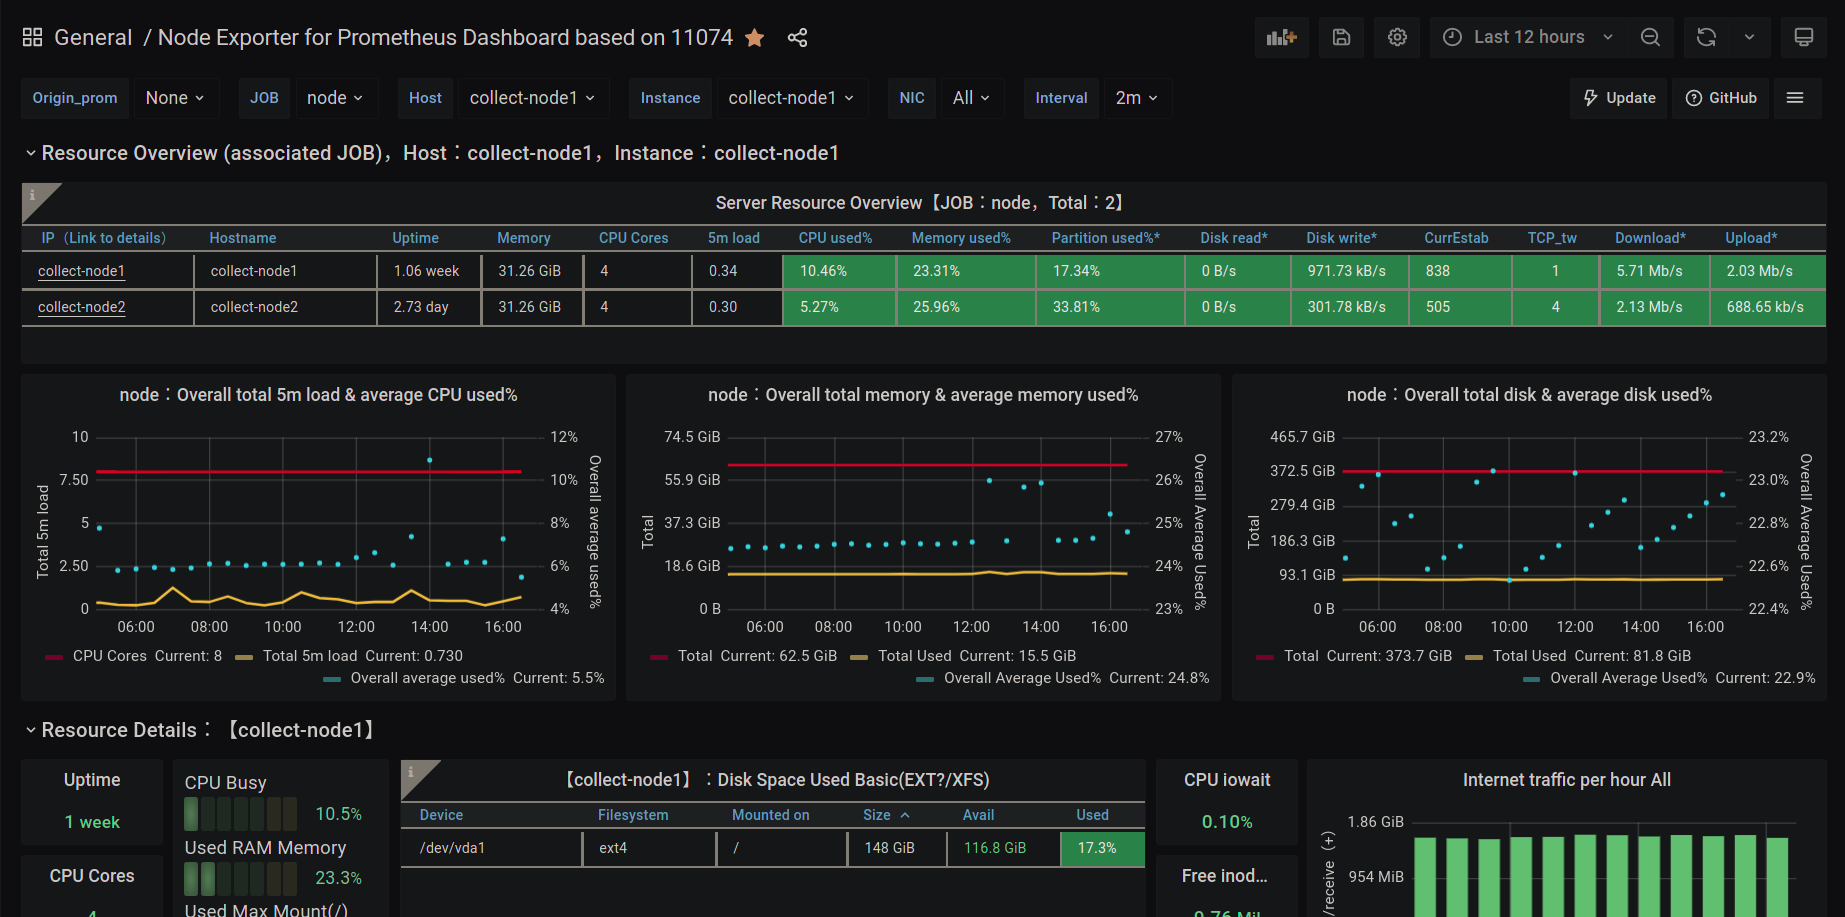
This dashboard monitors system health and resource utilization by visualizing metrics from node exporters. It highlights core metrics like node_disk_io_time_seconds_total, node_load1, and node_cpu_seconds_total to assess disk I/O performance, load trends, and per-core CPU usage, while alerting on thresholds and drilling into per-node aggregation for quick diagnostics.
Screenshots
Get Dashboard✕
Download
Copy to Clipboard