node-exporter disk graphs 5,054,5695,054,569
Description
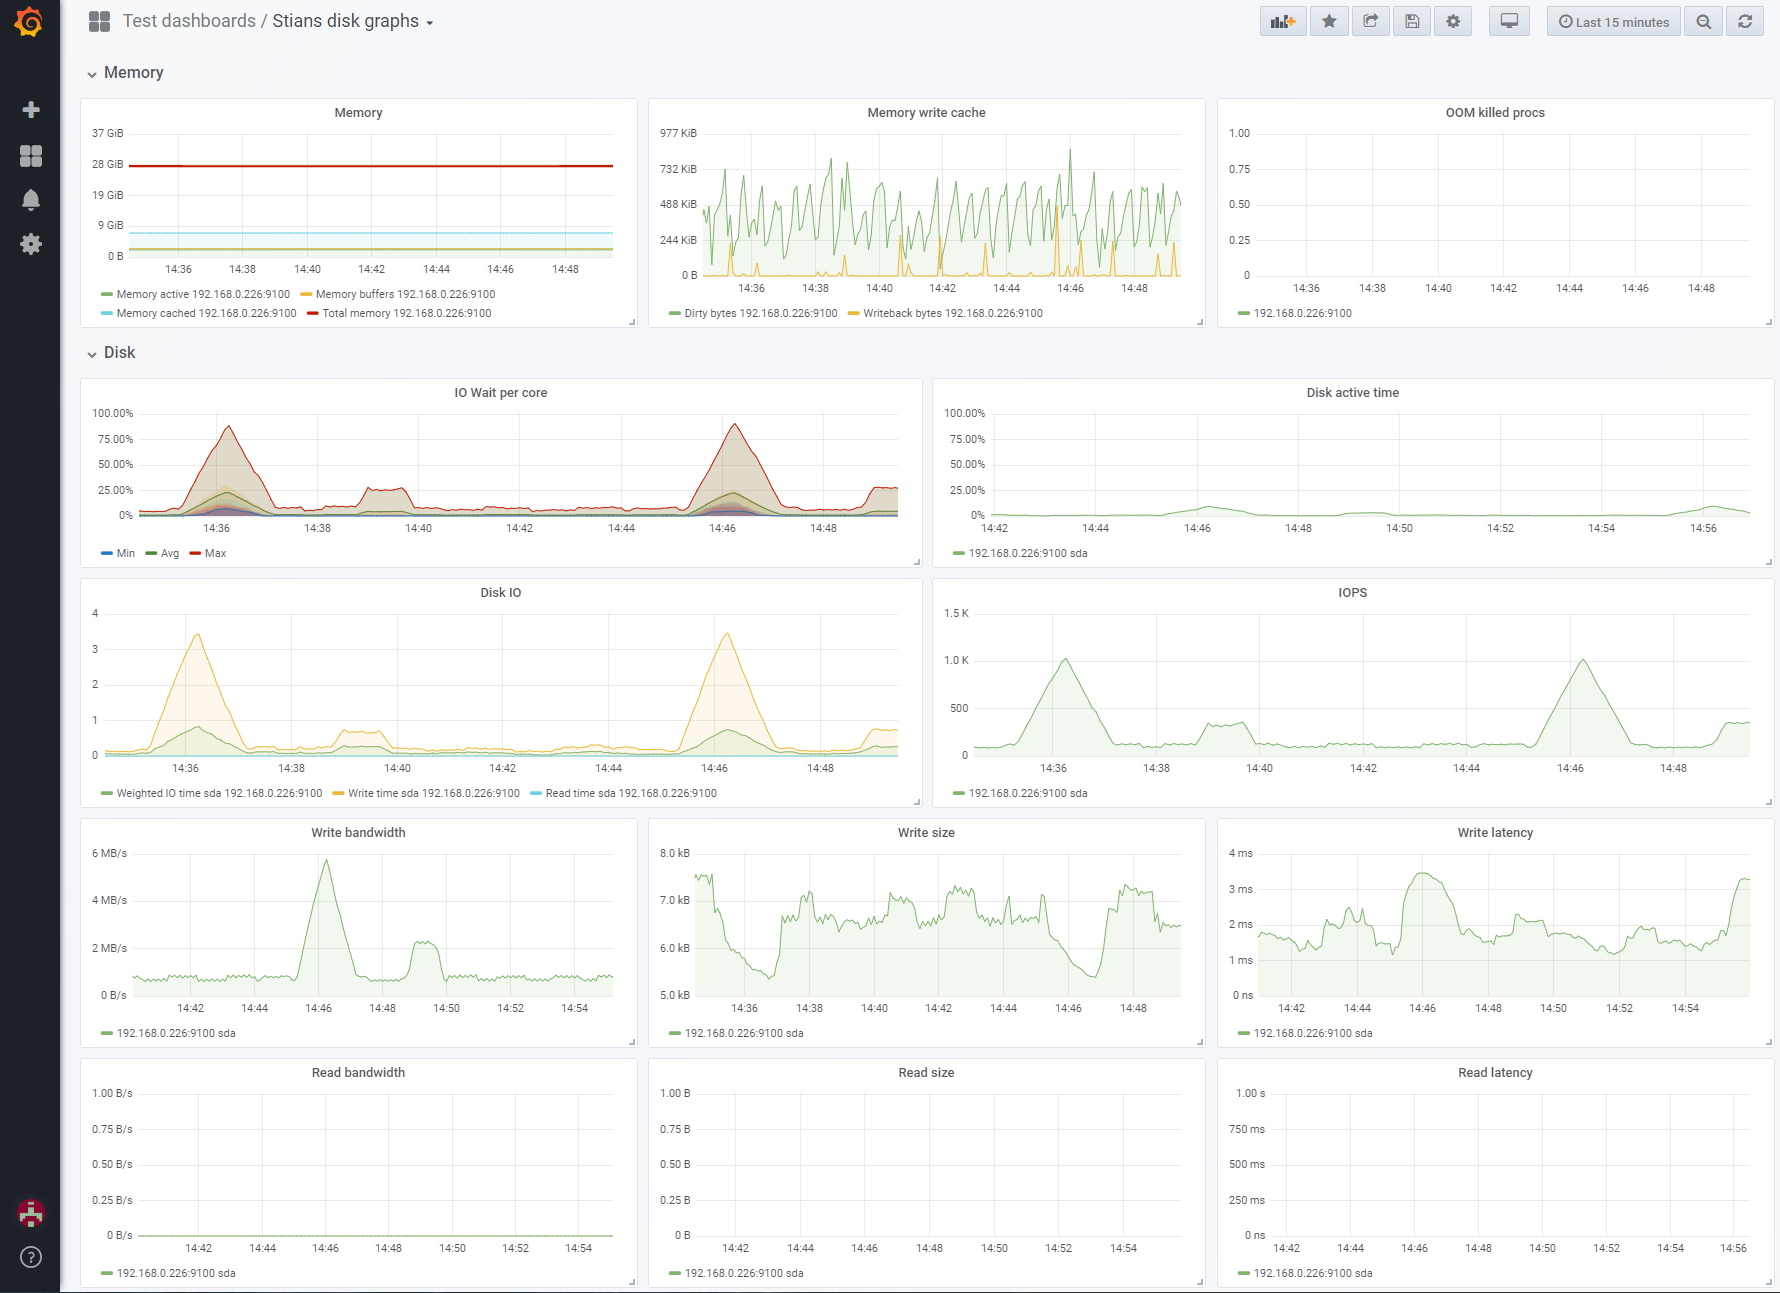
This dashboard monitors node disk and memory I/O performance, providing per-core IO wait, disk activity, and bandwidth metrics derived from Prometheus. It highlights key signals such as memory pressure with node_memory_Active_bytes alongside disk operations like node_disk_io_time_seconds_total, and captures latency and throughput with panels for reads and writes (e.g., Read latency, Write latency, Read bandwidth, Write bandwidth). It also surfaces OOM-related events via node_vmstat_oom_kill and uses RateInterval for rate-based metrics to normalize time-series data.
Screenshots
Used Metrics 1717
RateInterval
-
node_cpu_seconds_total
-
node_disk_io_time_seconds_total
-
node_disk_io_time_weighted_seconds_total
-
node_disk_read_bytes_total
-
node_disk_read_time_seconds_total
-
node_disk_reads_completed_total
-
node_disk_write_time_seconds_total
-
node_disk_writes_completed_total
-
node_disk_written_bytes_total
-
node_memory_Active_bytes
-
node_memory_Buffers_bytes
-
node_memory_Cached_bytes
-
node_memory_Dirty_bytes
-
node_memory_MemTotal_bytes
-
node_memory_Writeback_bytes
-
node_vmstat_oom_kill