Node Exporter Dashboard EN 20201010-StarsL.cn 1,219,0241,219,024 4.5 (45 reviews)
Description
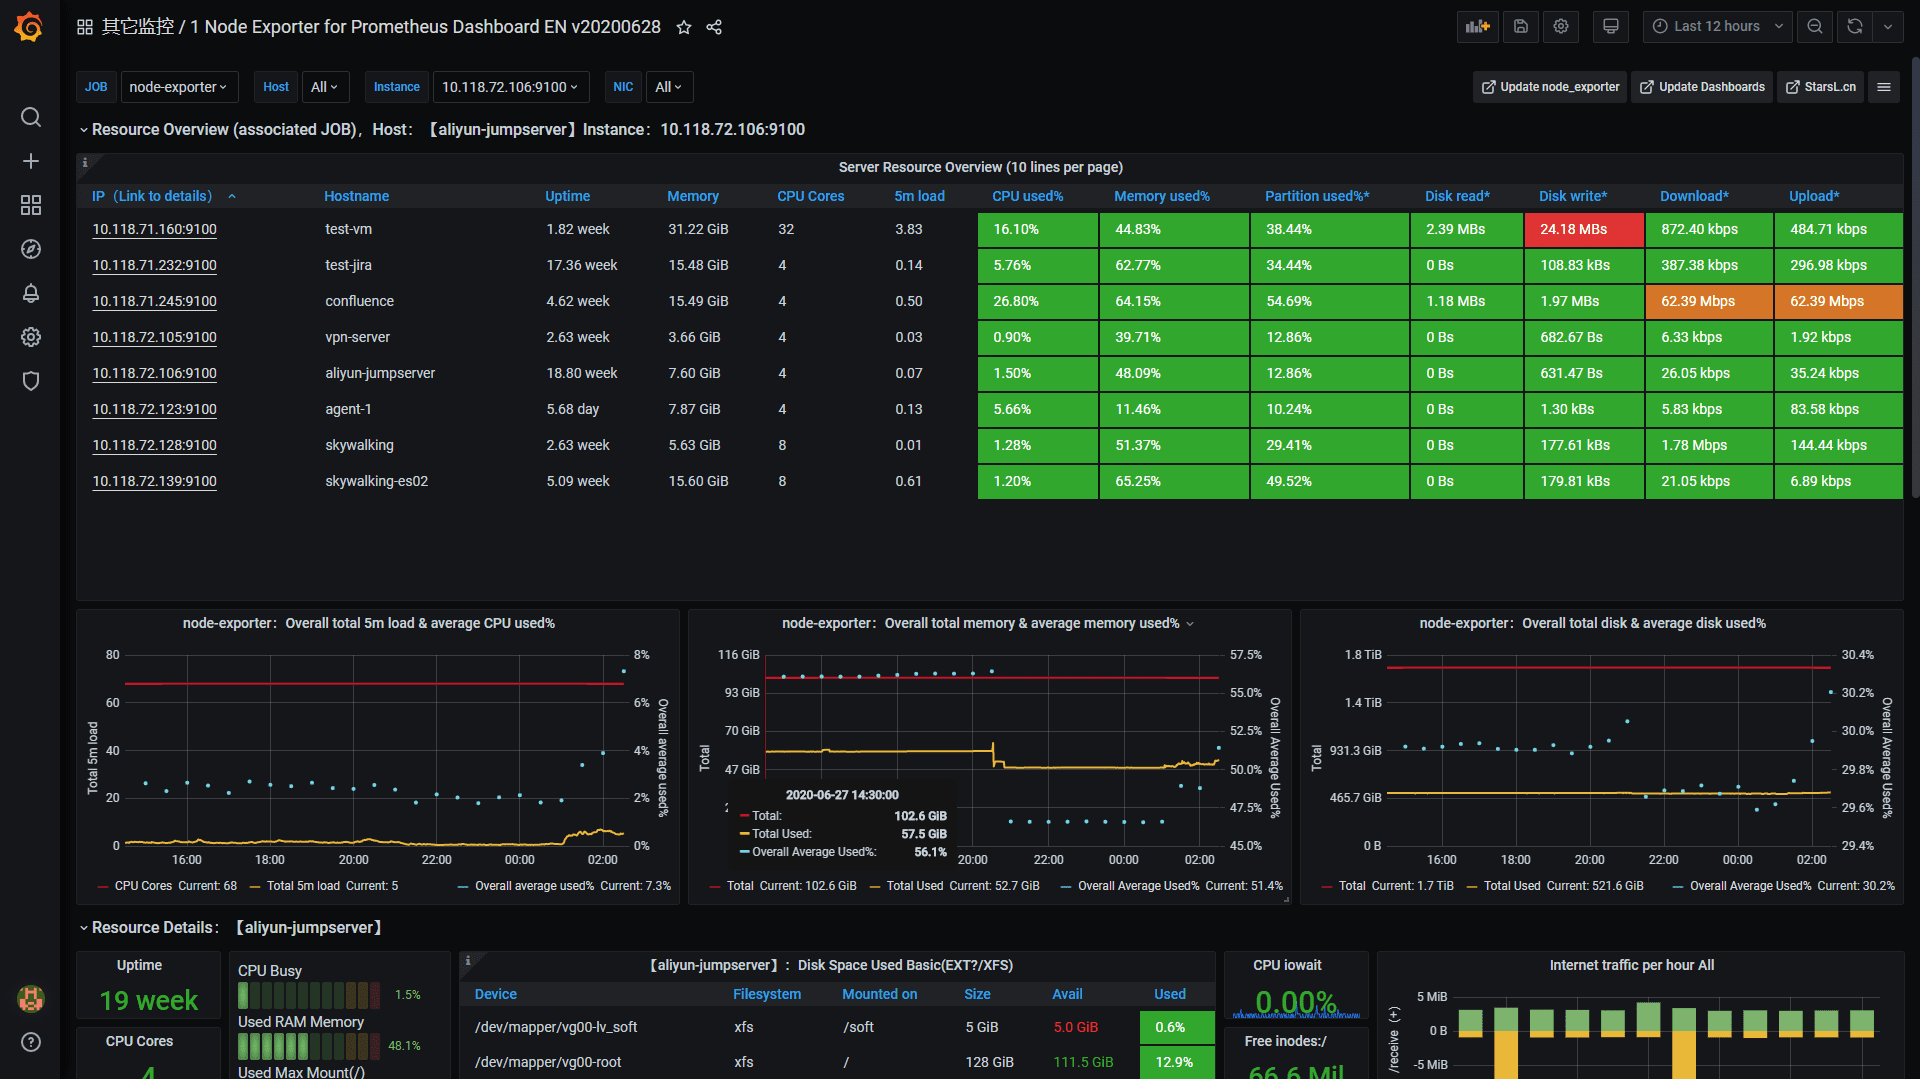
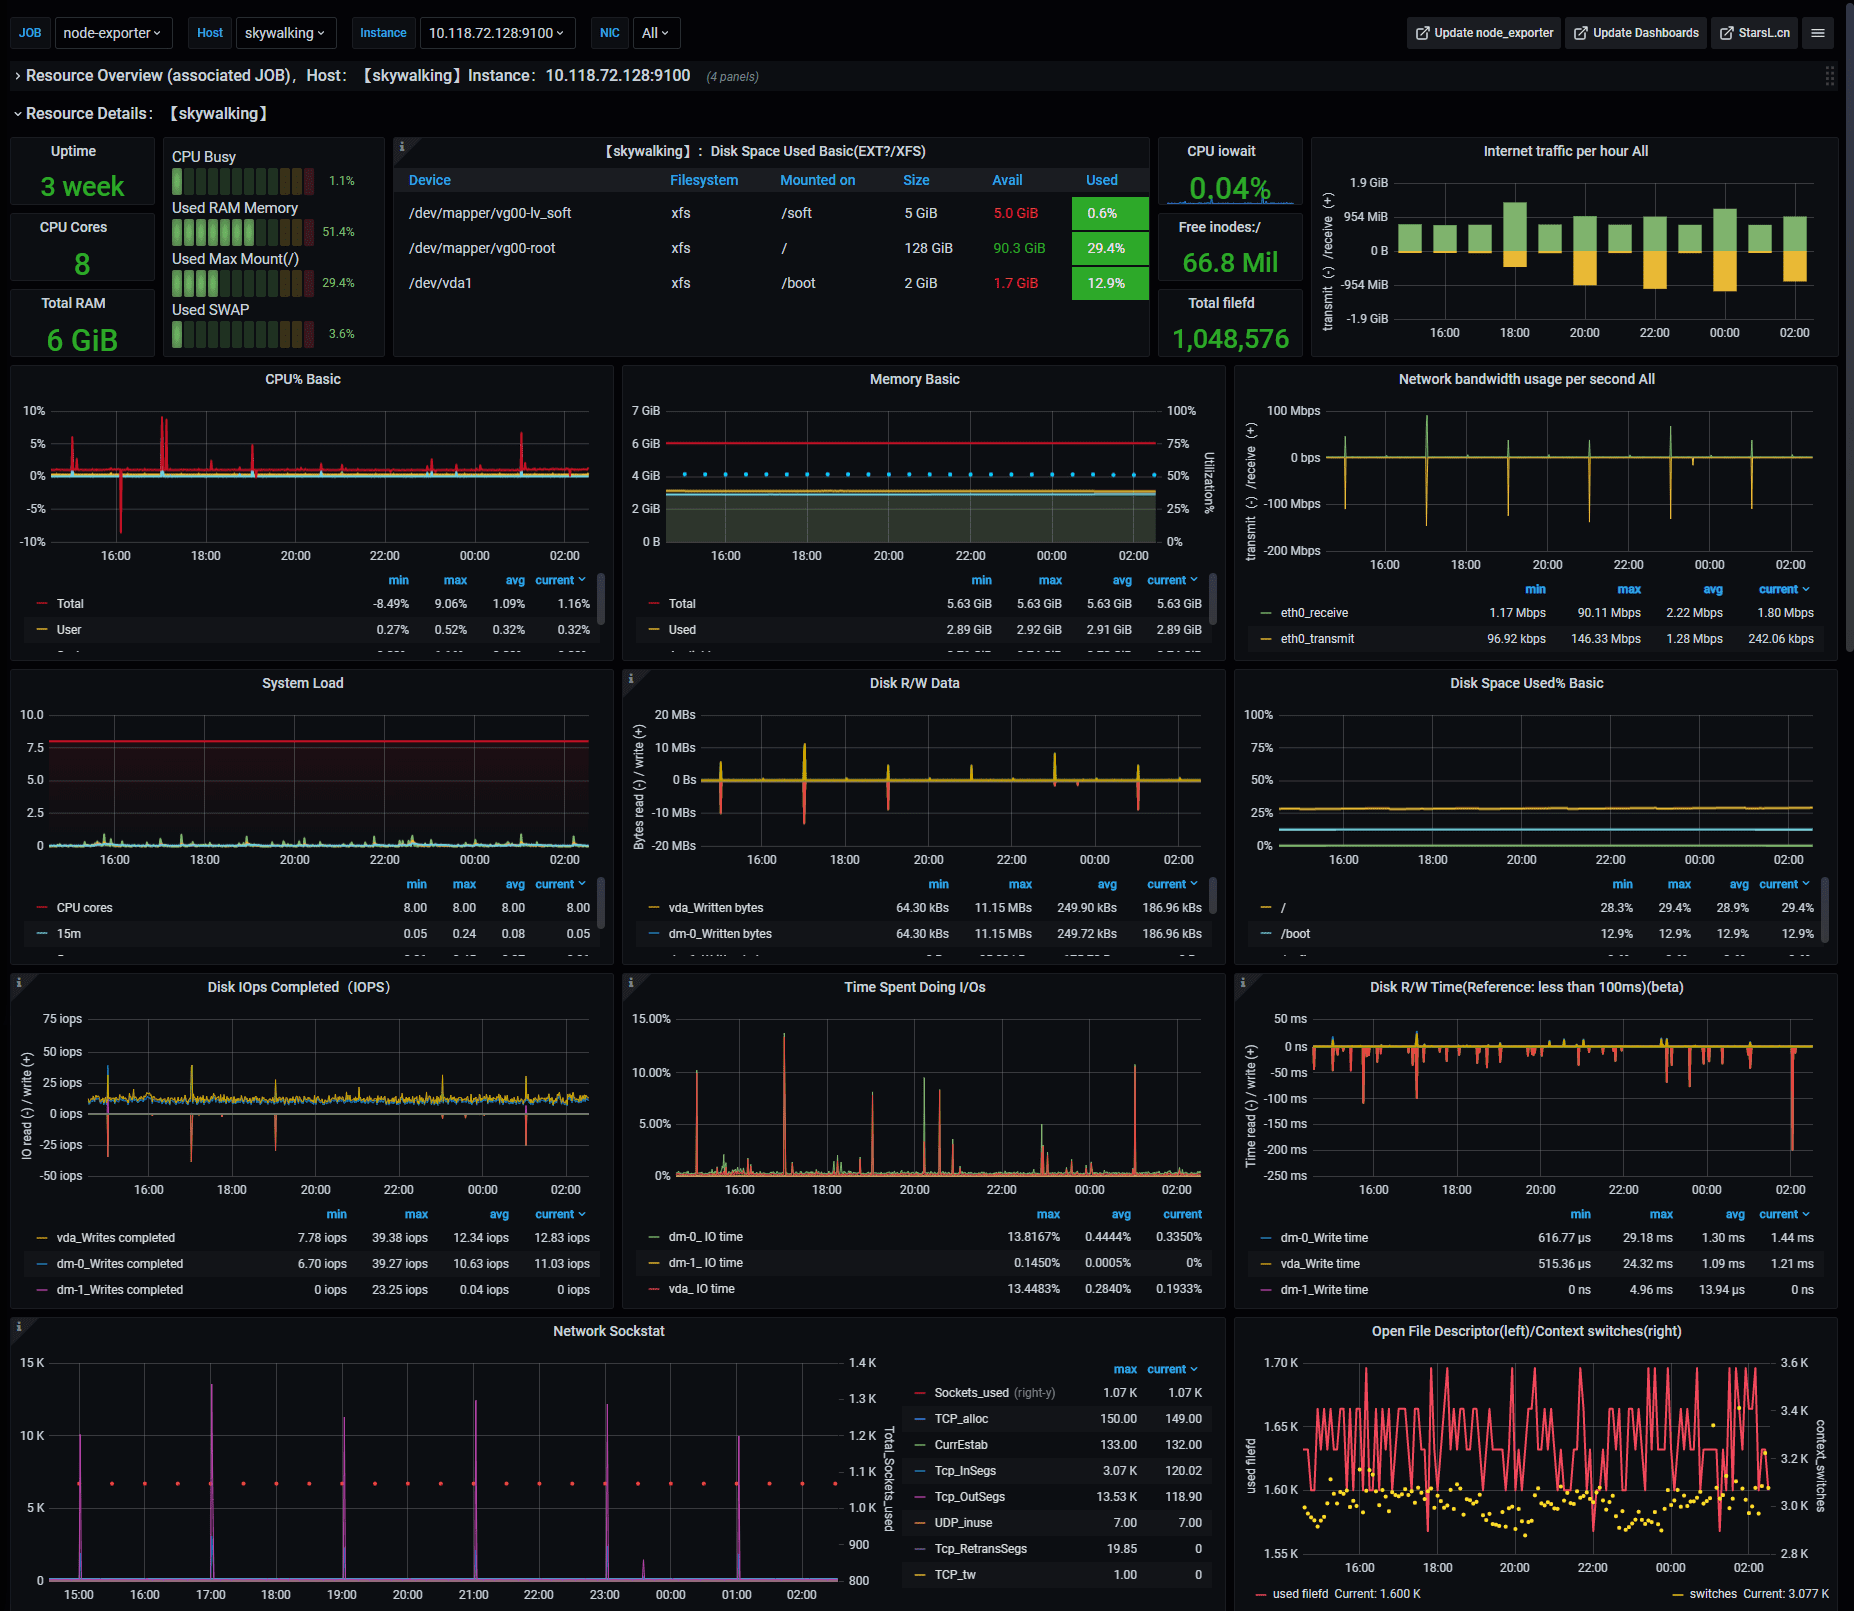
This dashboard provides a comprehensive health and performance overview of Linux nodes by aggregating core system metrics across multiple jobs. It highlights key indicators such as node_load5 (system load), node_cpu_seconds_total (CPU usage), and memory/file system stats like node_memory_MemTotal_bytes vs node_memory_MemAvailable_bytes to gauge capacity and pressure. It also surfaces disk and I/O activity (e.g., disk space usage and I/O throughput) and network traffic per device, enabling quick detection of bottlenecks and degraded performance.
Screenshots
Used Metrics 4444
interval
-
node_boot_time_seconds
-
node_context_switches_total
-
node_cpu_seconds_total
-
node_disk_io_now
-
node_disk_io_time_seconds_total
-
node_disk_io_time_weighted_seconds_total
-
node_disk_read_bytes_total
-
node_disk_read_time_seconds_total
-
node_disk_reads_completed_total
-
node_disk_write_time_seconds_total
-
node_disk_writes_completed_total
-
node_disk_written_bytes_total
-
node_filefd_allocated
-
node_filefd_maximum
-
node_filesystem_avail_bytes
-
node_filesystem_files
-
node_filesystem_files_free
-
node_filesystem_free_bytes
-
node_filesystem_size_bytes
-
node_load1
-
node_load15
-
node_load5
-
node_memory_Buffers_bytes
-
node_memory_Cached_bytes
-
node_memory_MemAvailable_bytes
-
node_memory_MemFree_bytes
-
node_memory_MemTotal_bytes
-
node_memory_SwapFree_bytes
-
node_memory_SwapTotal_bytes
-
node_netstat_TcpExt_ListenDrops
-
node_netstat_Tcp_ActiveOpens
-
node_netstat_Tcp_CurrEstab
-
node_netstat_Tcp_InSegs
-
node_netstat_Tcp_OutSegs
-
node_netstat_Tcp_PassiveOpens
-
node_netstat_Tcp_RetransSegs
-
node_network_receive_bytes_total
-
node_network_transmit_bytes_total
-
node_sockstat_TCP_alloc
-
node_sockstat_TCP_tw
-
node_sockstat_UDP_inuse
-
node_sockstat_sockets_used
-
node_uname_info