
Node Exporter Dashboard 20240520 TenSunS自动同步版 111,290111,290 4.1 (73 reviews)
Description
This dashboard monitors node resource utilization with a focus on system-wide overview and per-group aggregation, displaying metrics like node_cpu_seconds_total, node_load5, and memory/disk usage to assess current capacity and trends. It features a consolidated resource overview table (grouped by $group, showing total hosts), and panels for ~7-day P99 resource usage, alongside aggregates such as overall load vs. average CPU, and overall memory/disk usage. Key metrics include CPU time distribution, memory availability, and filesystem capacity, enabling quick identification of bottlenecks and capacity planning.
Screenshots
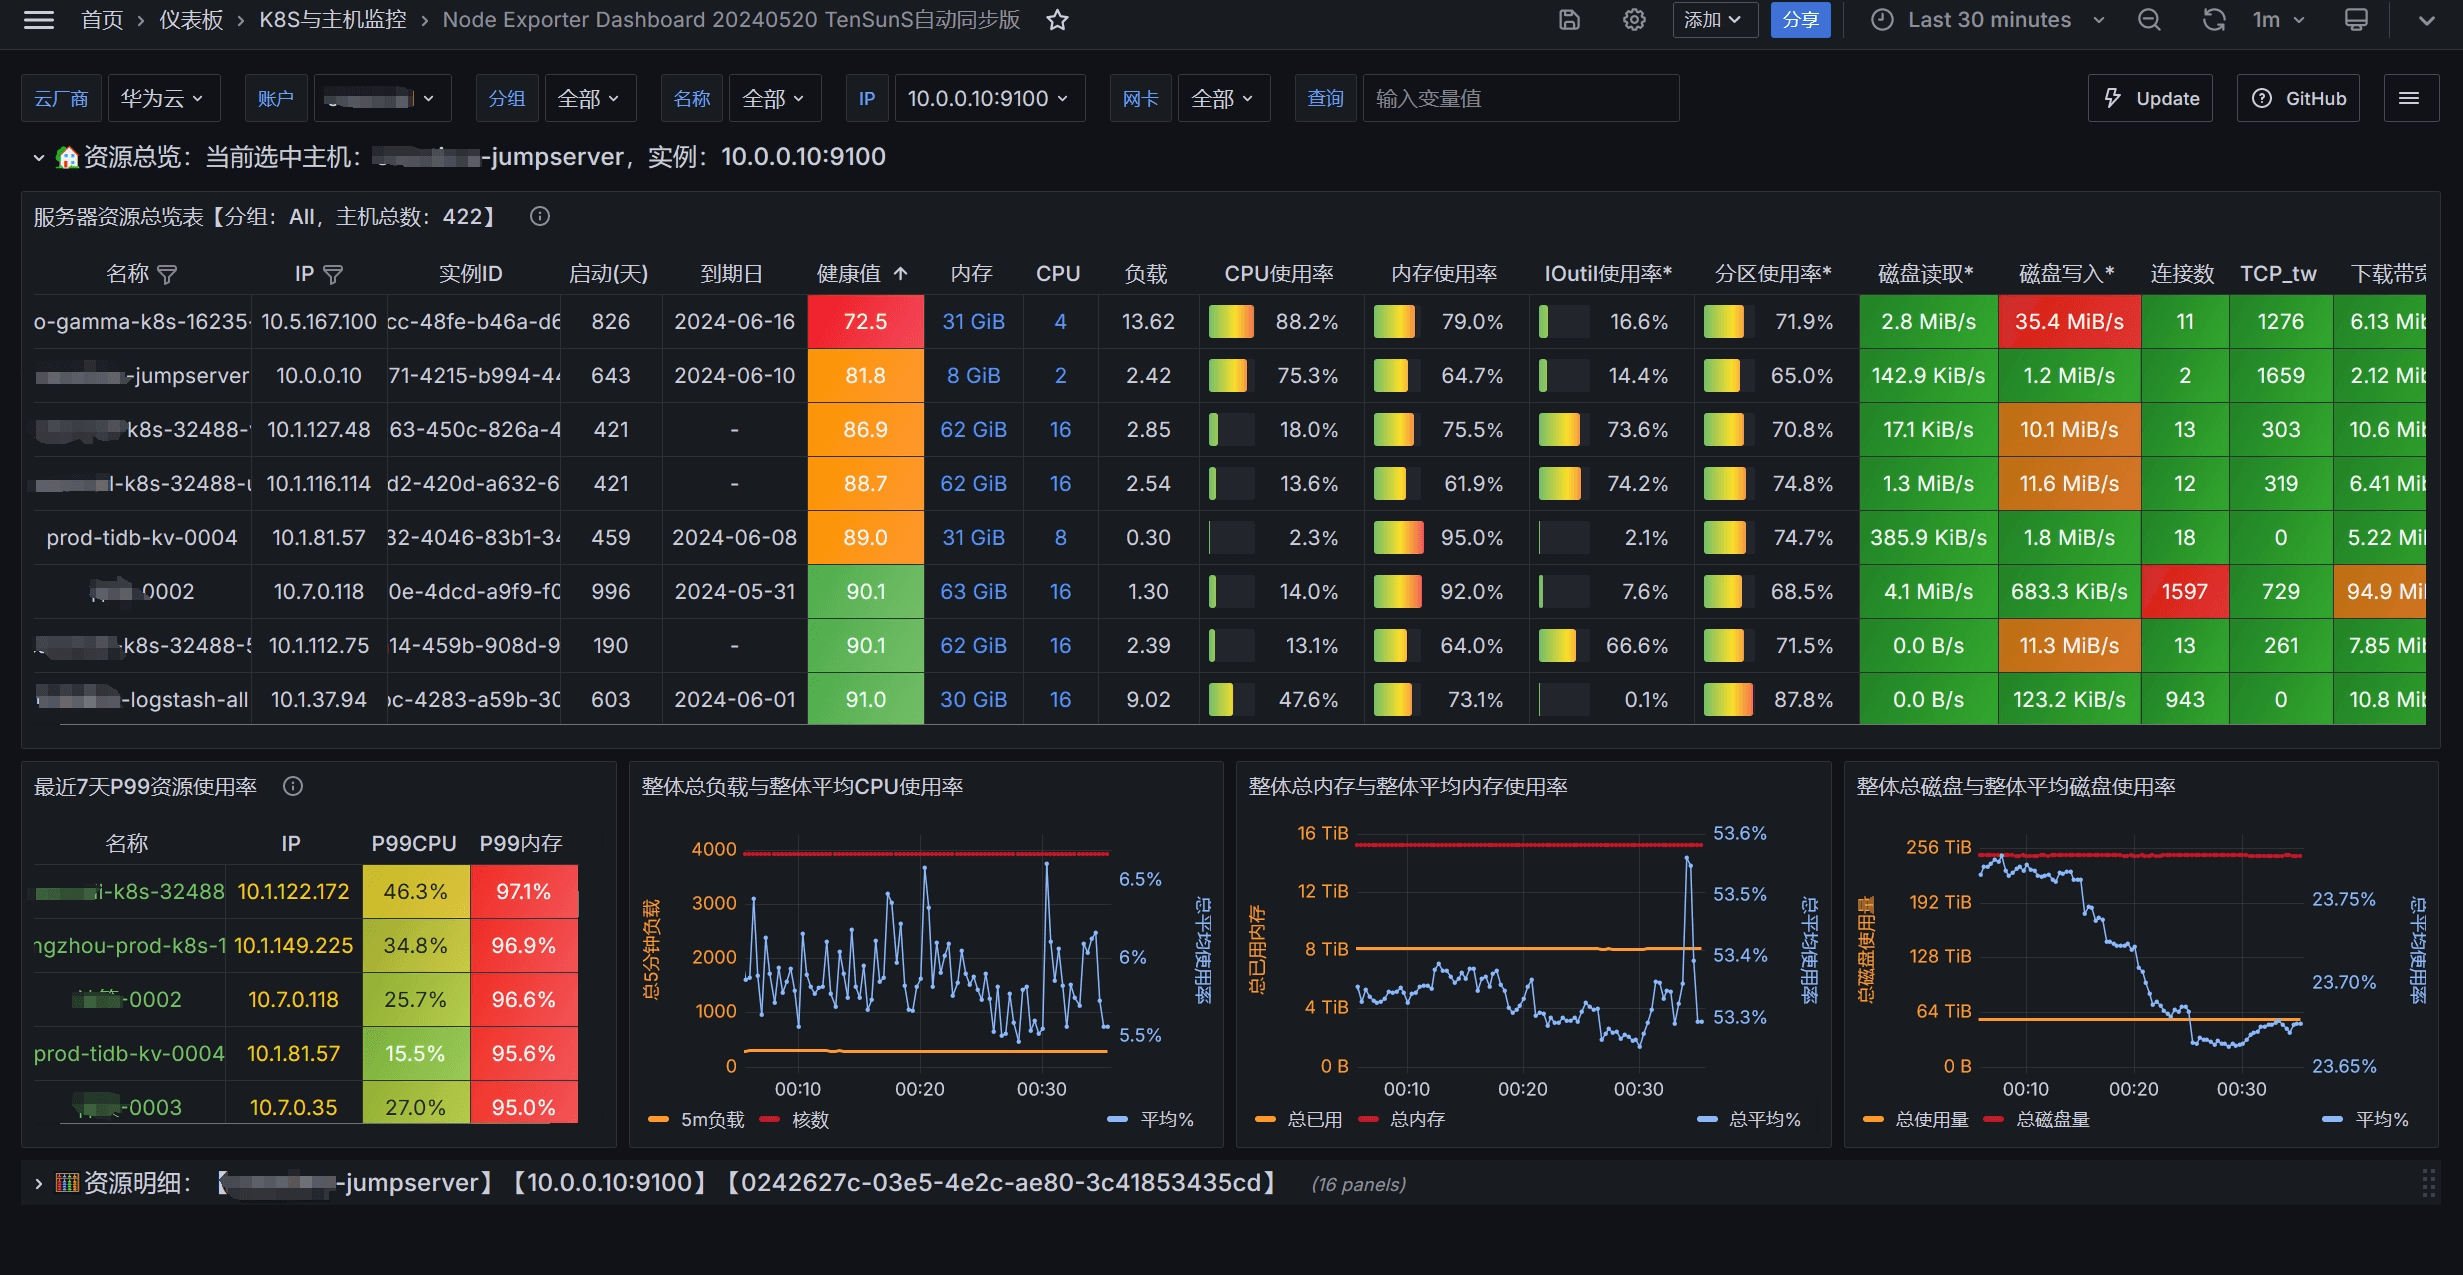
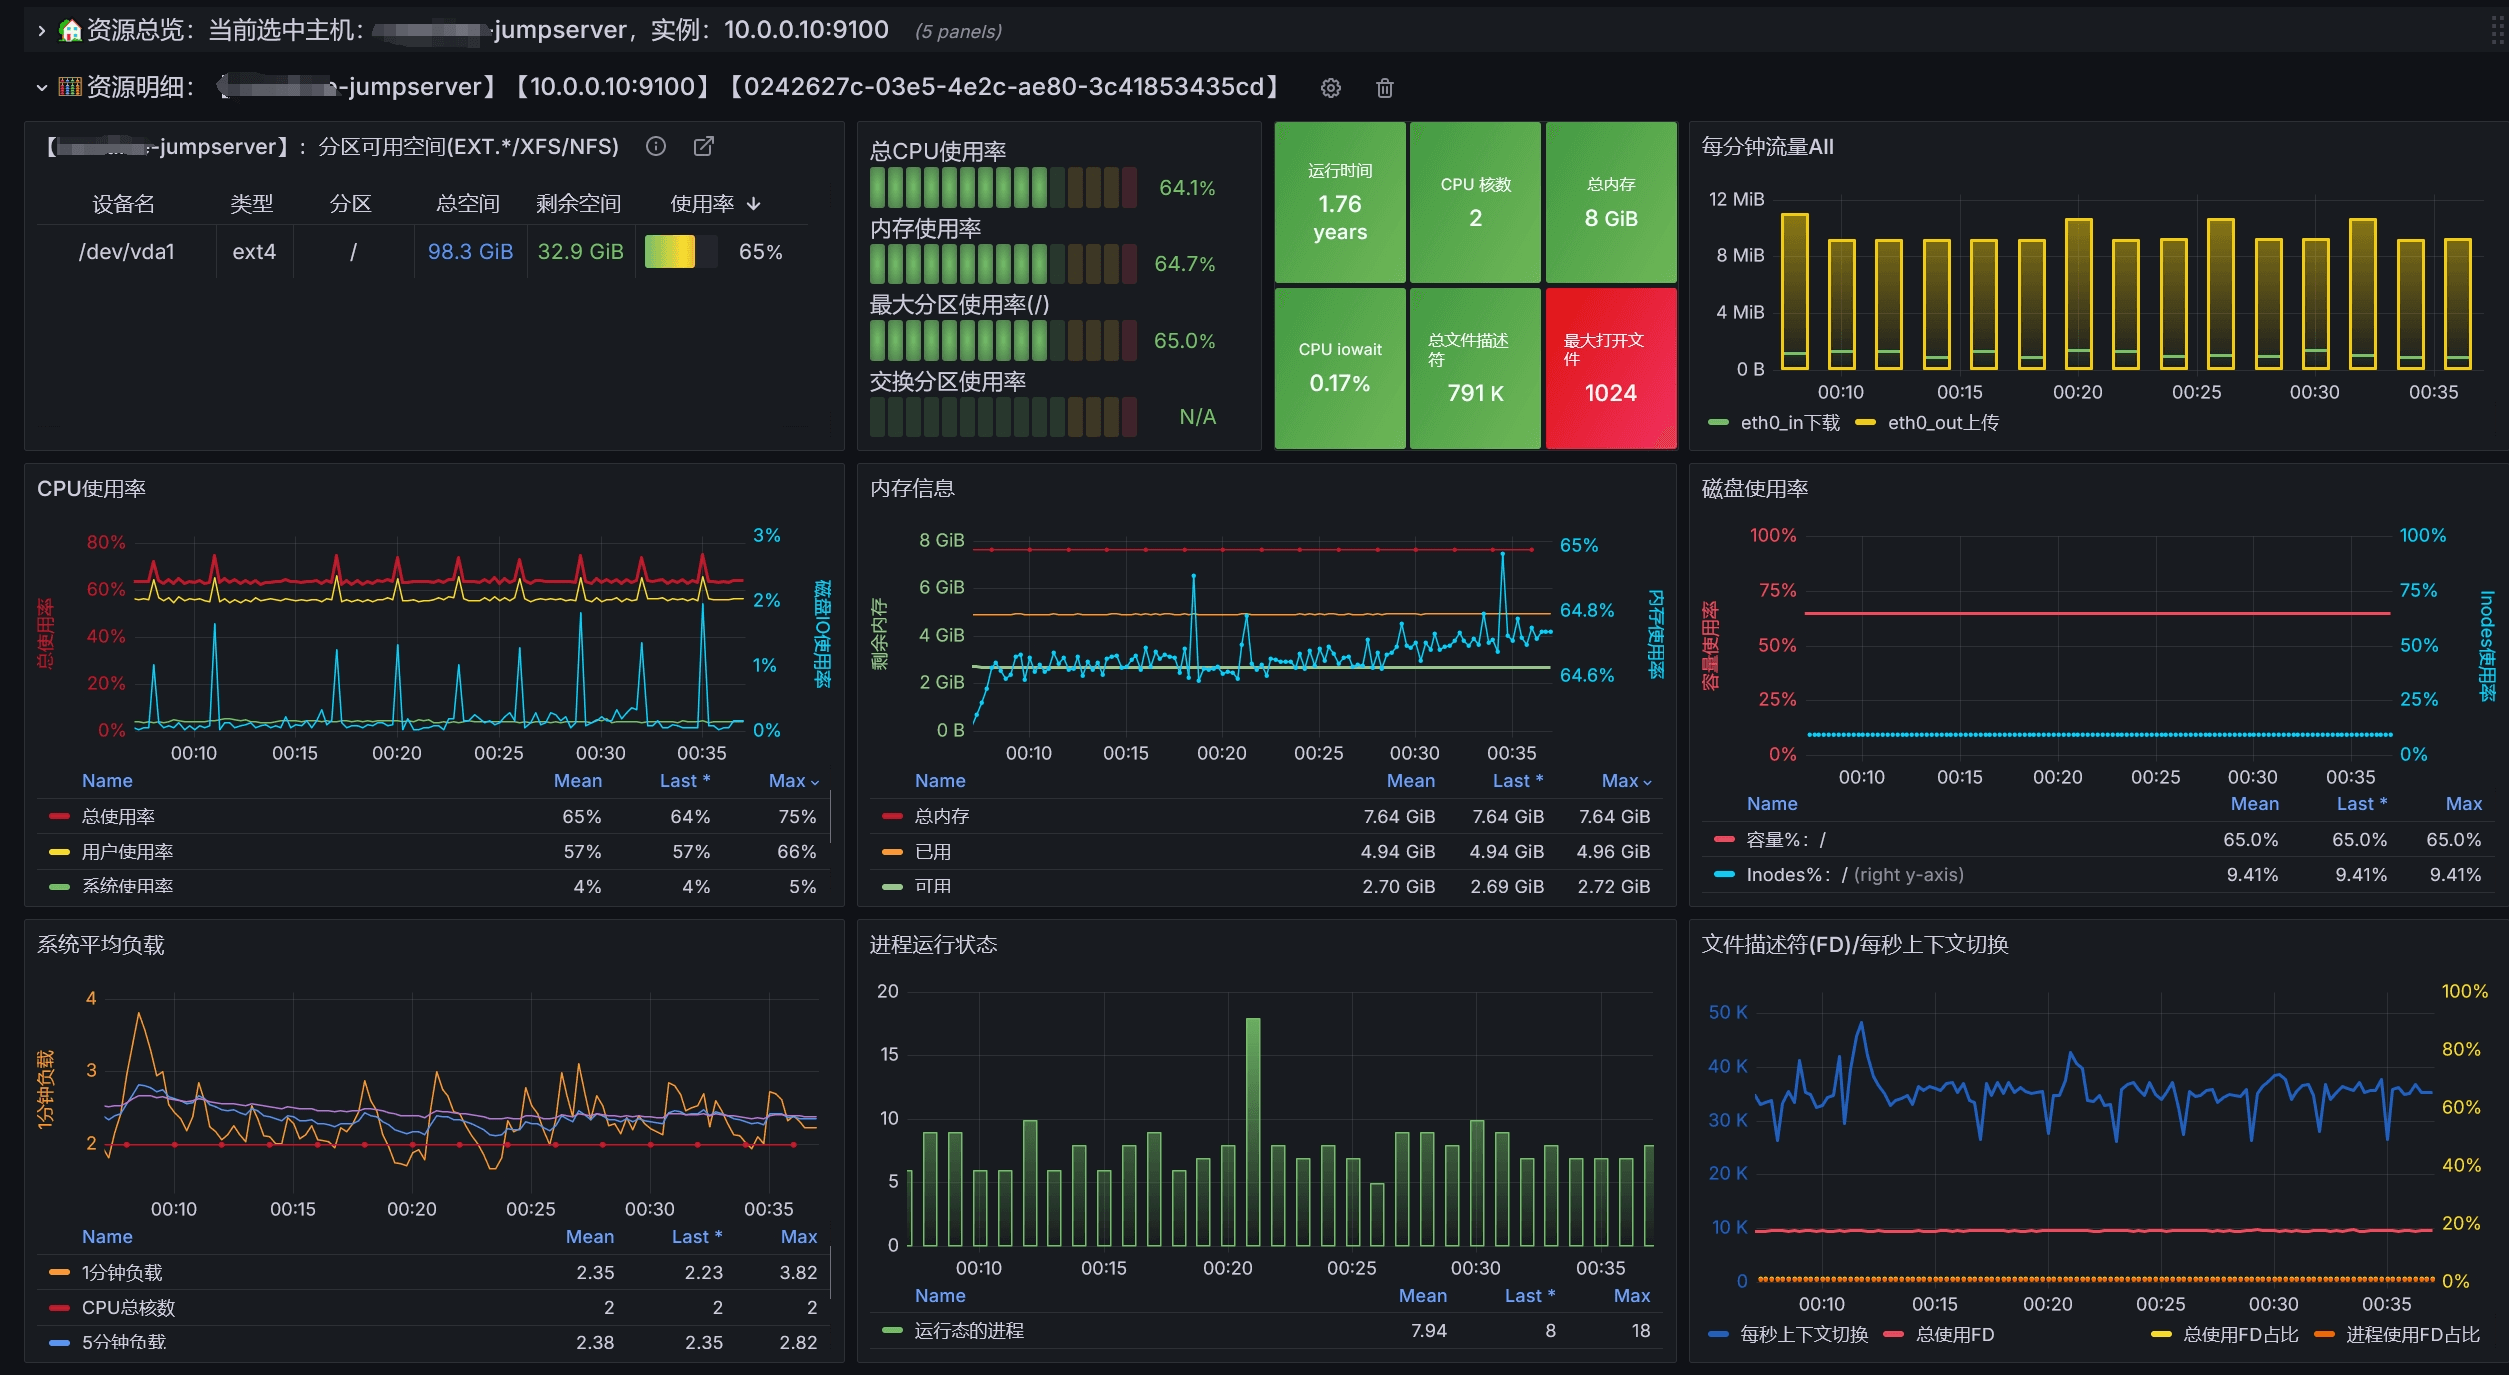
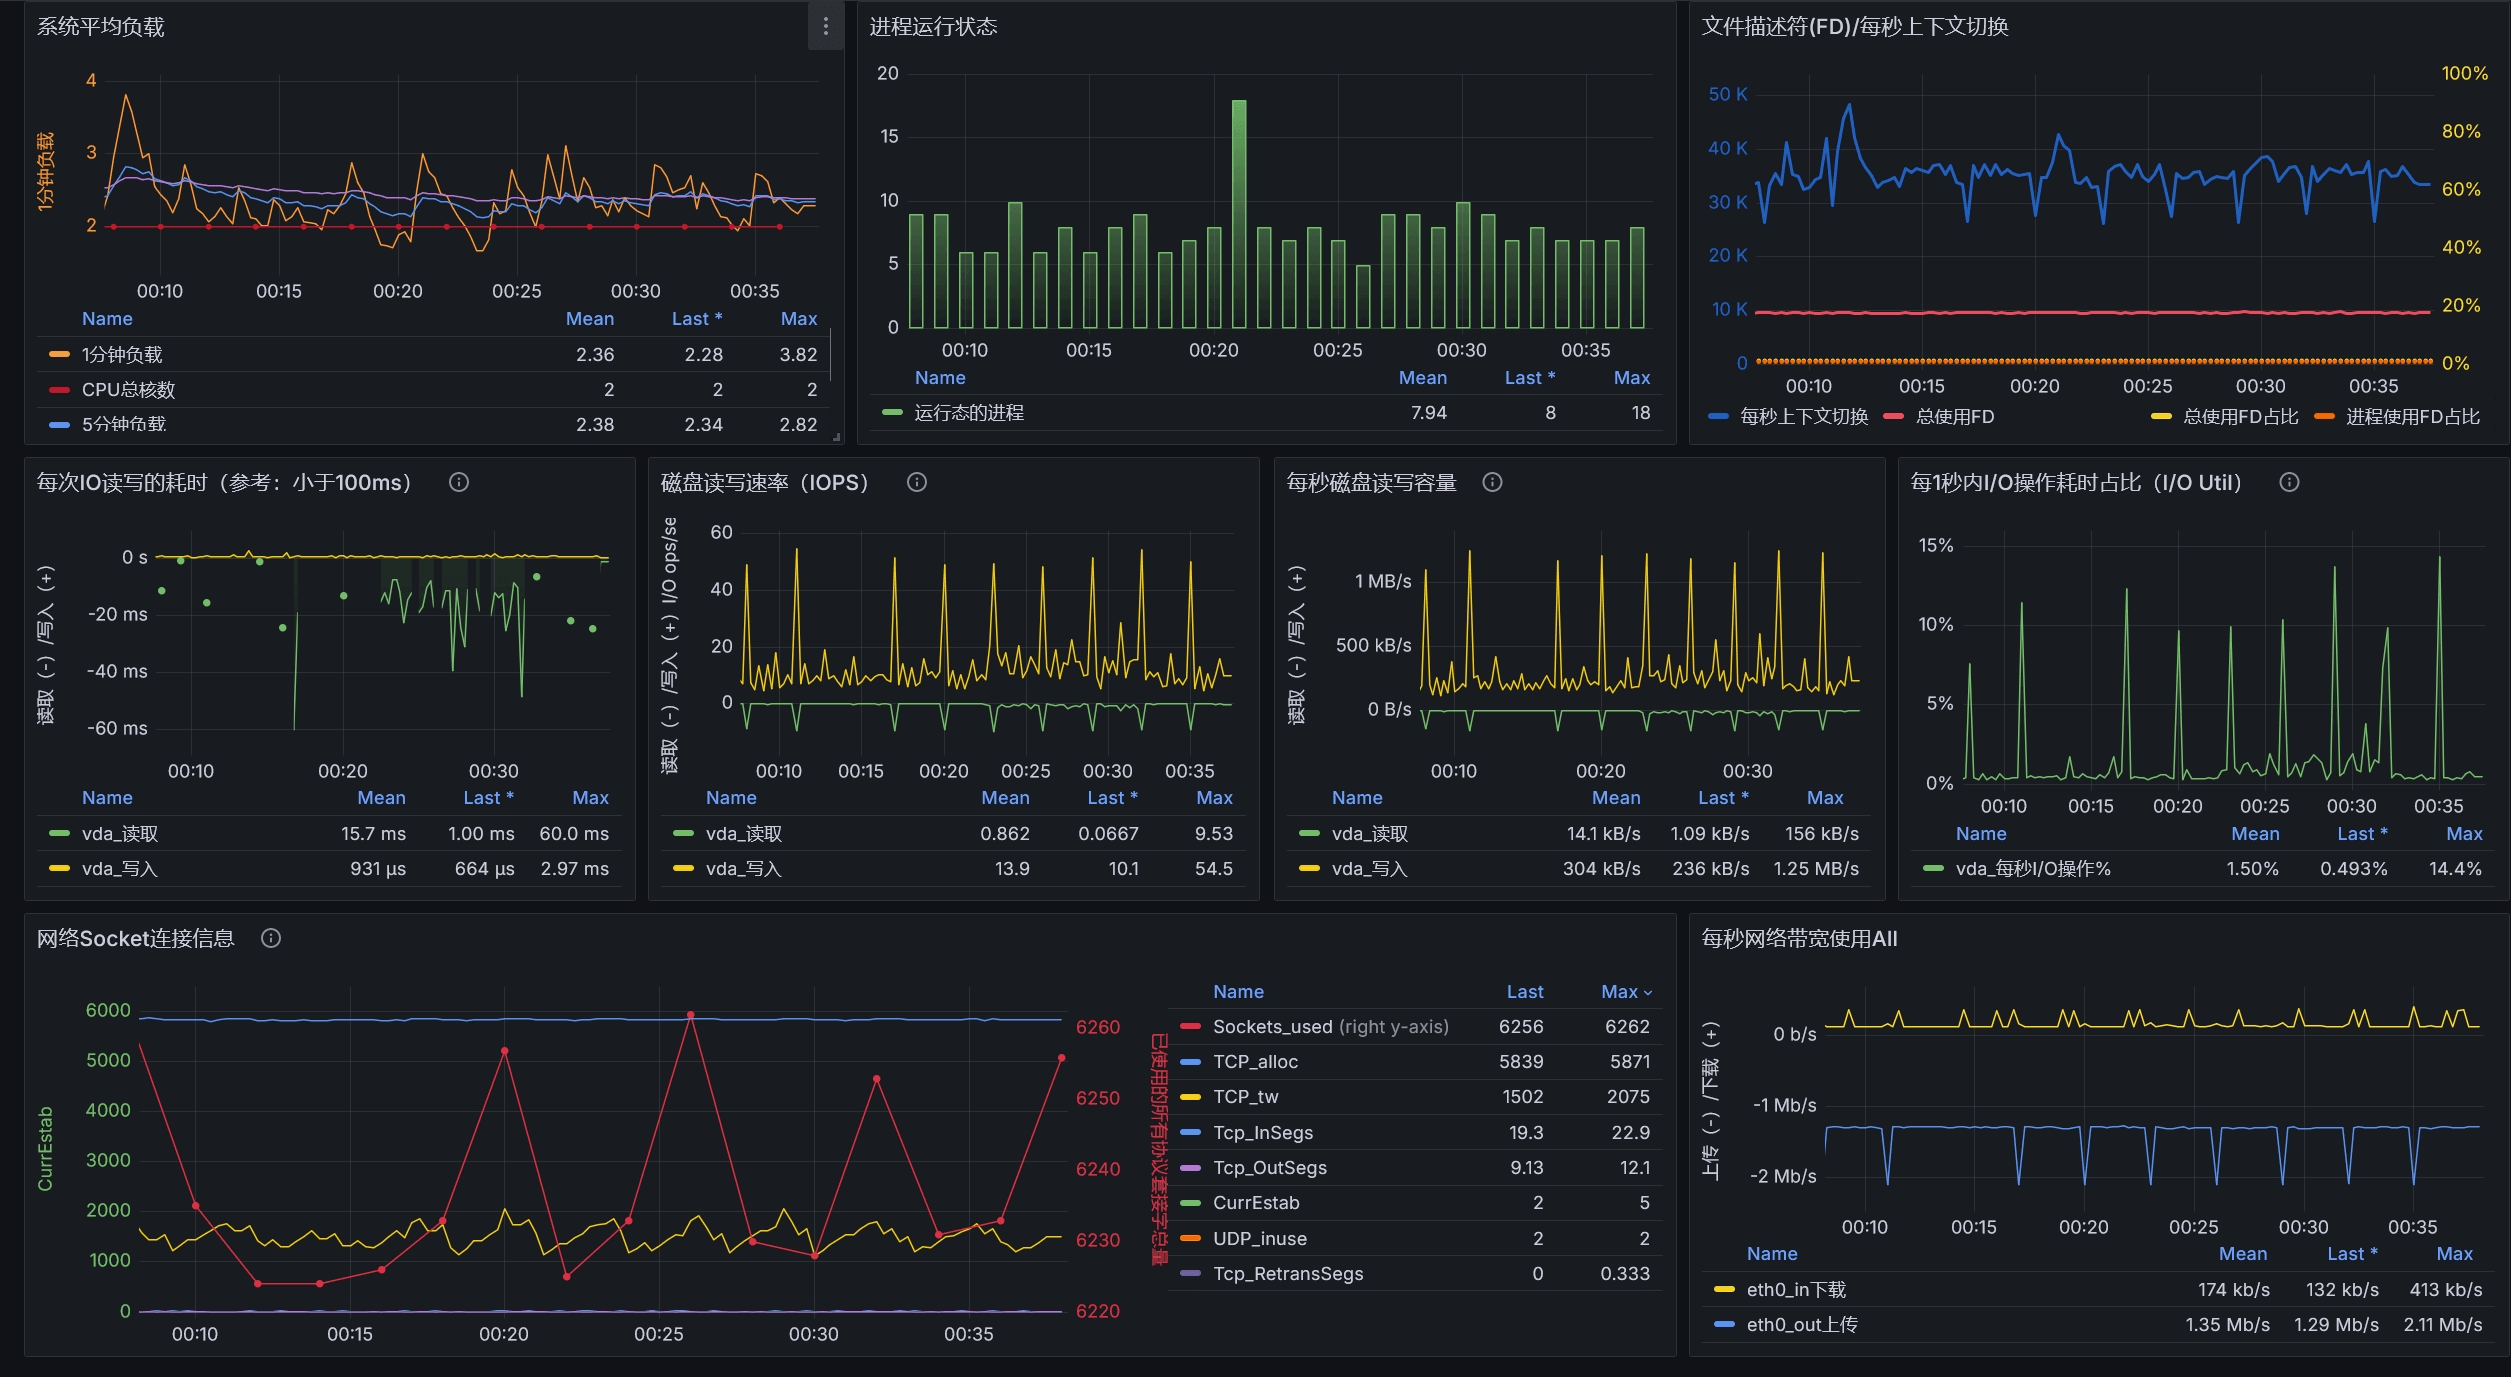
Used Metrics 2121
:
cpu:usage:rate
interval
mem:usage:rate
-
node_boot_time_seconds
-
node_cpu_seconds_total
-
node_disk_io_time_seconds_total
-
node_disk_read_bytes_total
-
node_disk_written_bytes_total
-
node_filesystem_avail_bytes
-
node_filesystem_free_bytes
-
node_filesystem_size_bytes
-
node_load5
-
node_memory_MemAvailable_bytes
-
node_memory_MemTotal_bytes
-
node_netstat_Tcp_CurrEstab
-
node_network_receive_bytes_total
-
node_network_transmit_bytes_total
-
node_sockstat_TCP_tw
-
node_uname_info
quantile_over_time