NiFi PrometheusReportingTask Dashboard 504,061504,061 5.0 (1 reviews)
5/17/2020
5/17/2020
1
>=6.7.3
Prometheus
Description
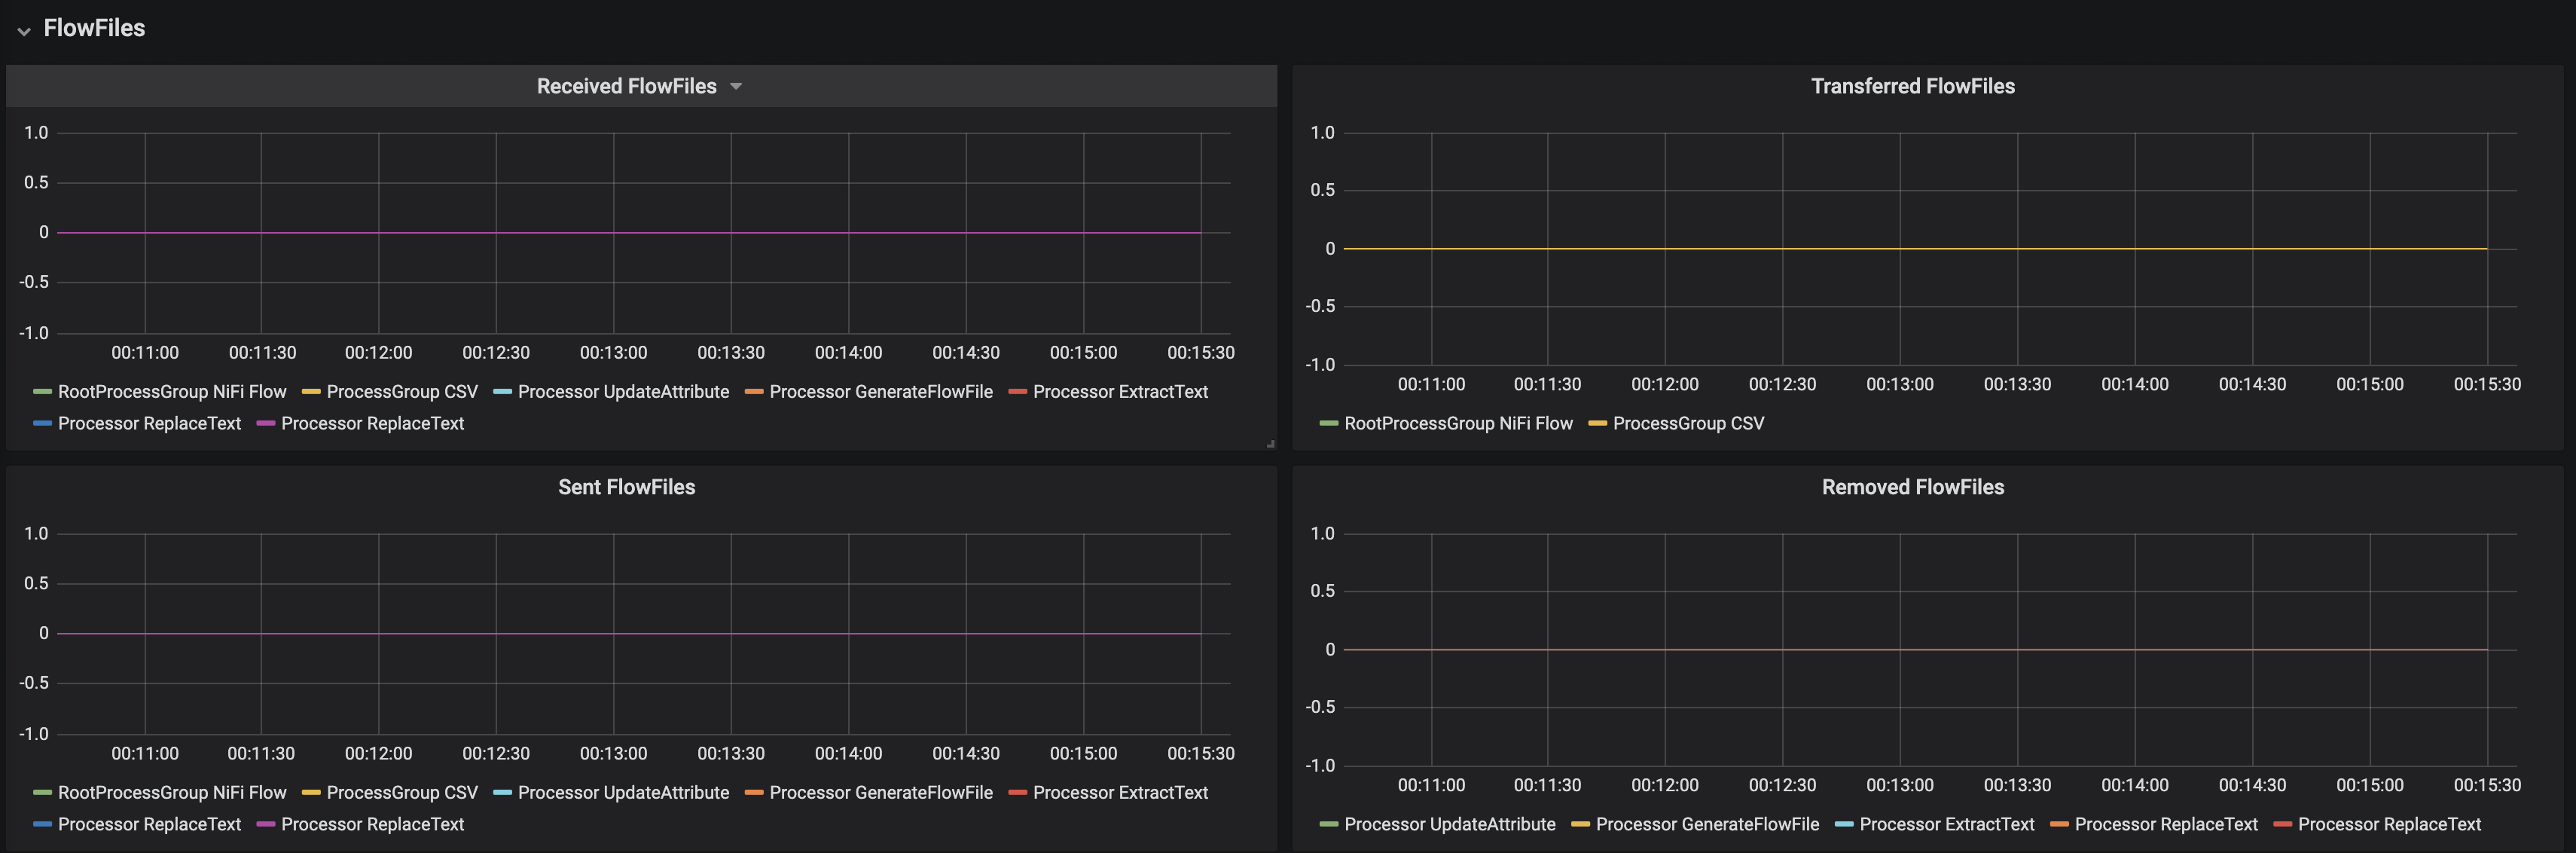
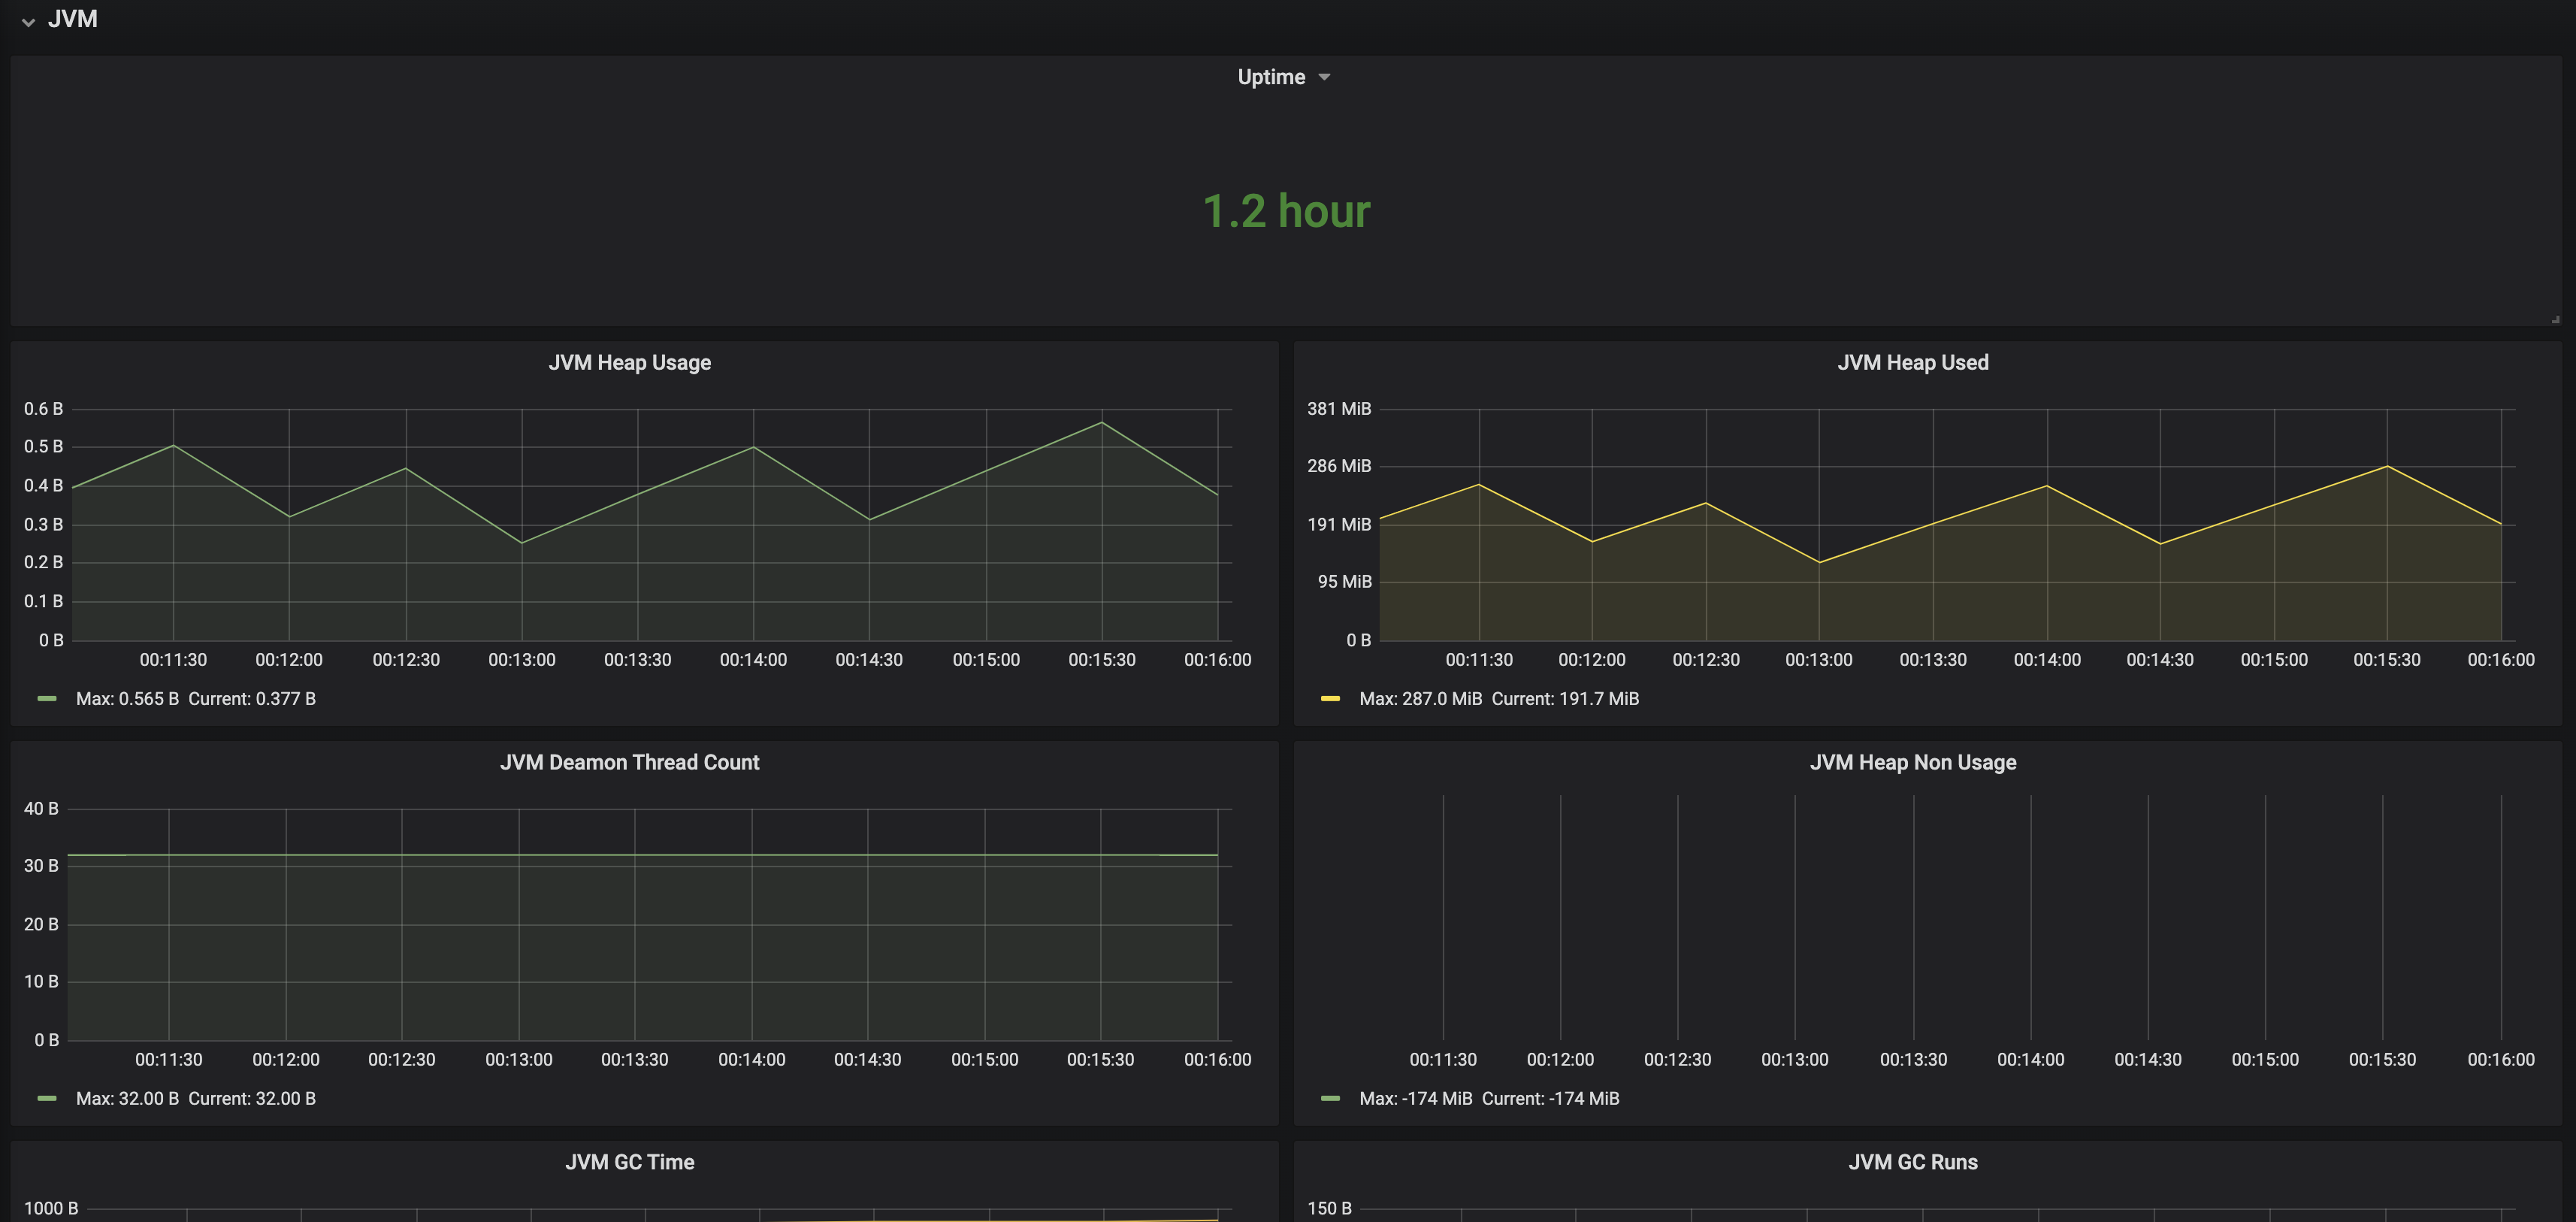
This dashboard monitors NiFi Prometheus Reporting Tasks by aggregating key operational signals and exposing them in a time-series view for real-time health and performance analysis. It highlights latency, throughput, and error rate through panels that track nifi_reporting_task_latency_seconds, nifi_reporting_task_throughput_events, and nifi_reporting_task_error_rate respectively, enabling quick detection of slow tasks, high volume activity, and failures. The panels are designed to correlate these metrics with task state and flow progress, providing actionable insight for tuning NiFi metrics collection and ensuring reliable data delivery.
Screenshots
Get Dashboard✕
Download
Copy to Clipboard