NiFi JMX exporter 850850
12/17/2018
12/17/2018
1
Docker
>=5.2.4
Prometheus
Description
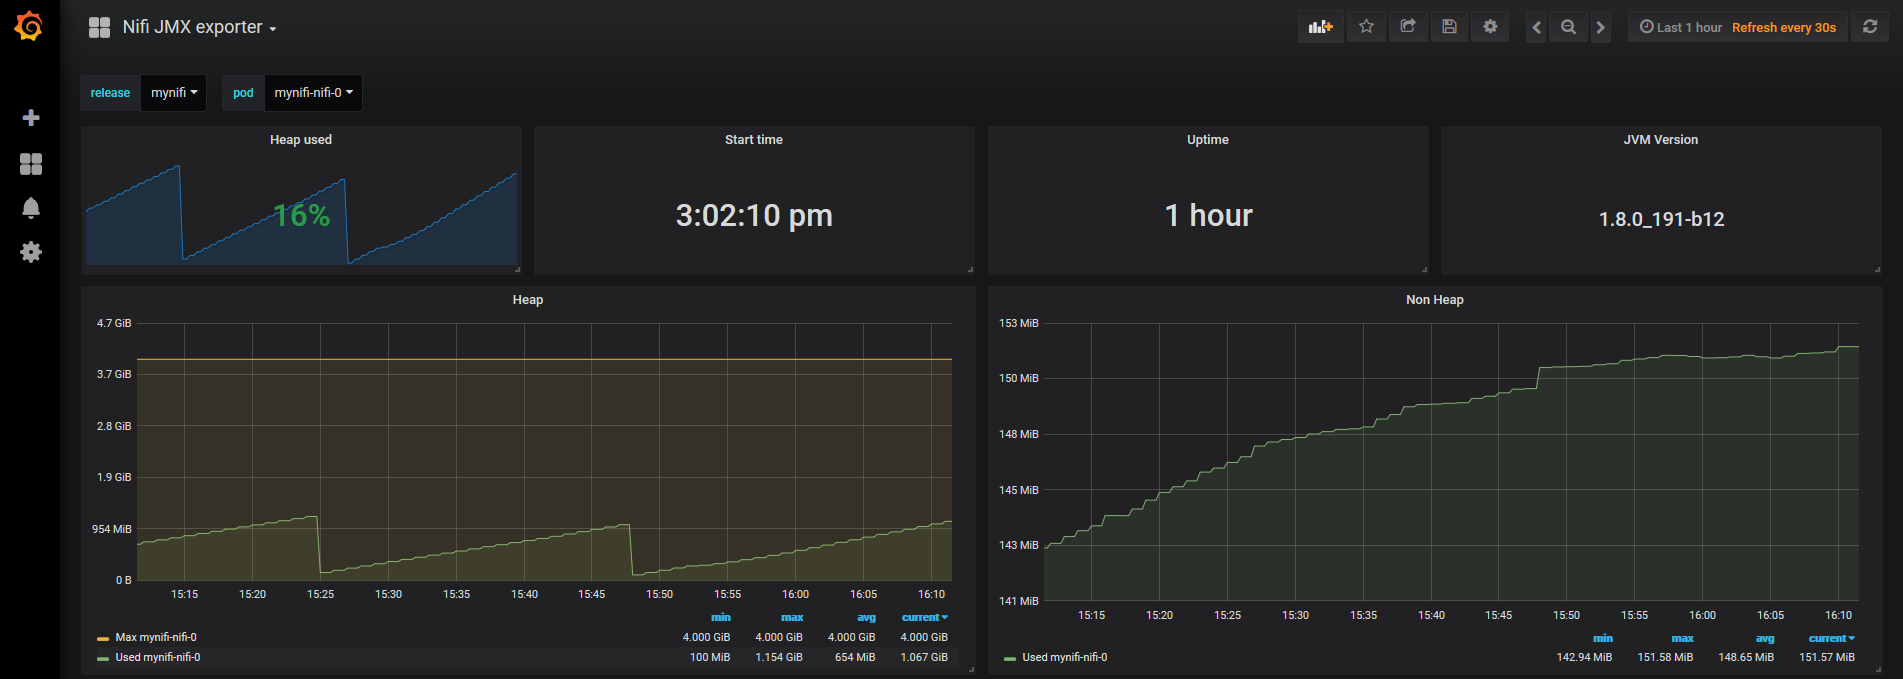
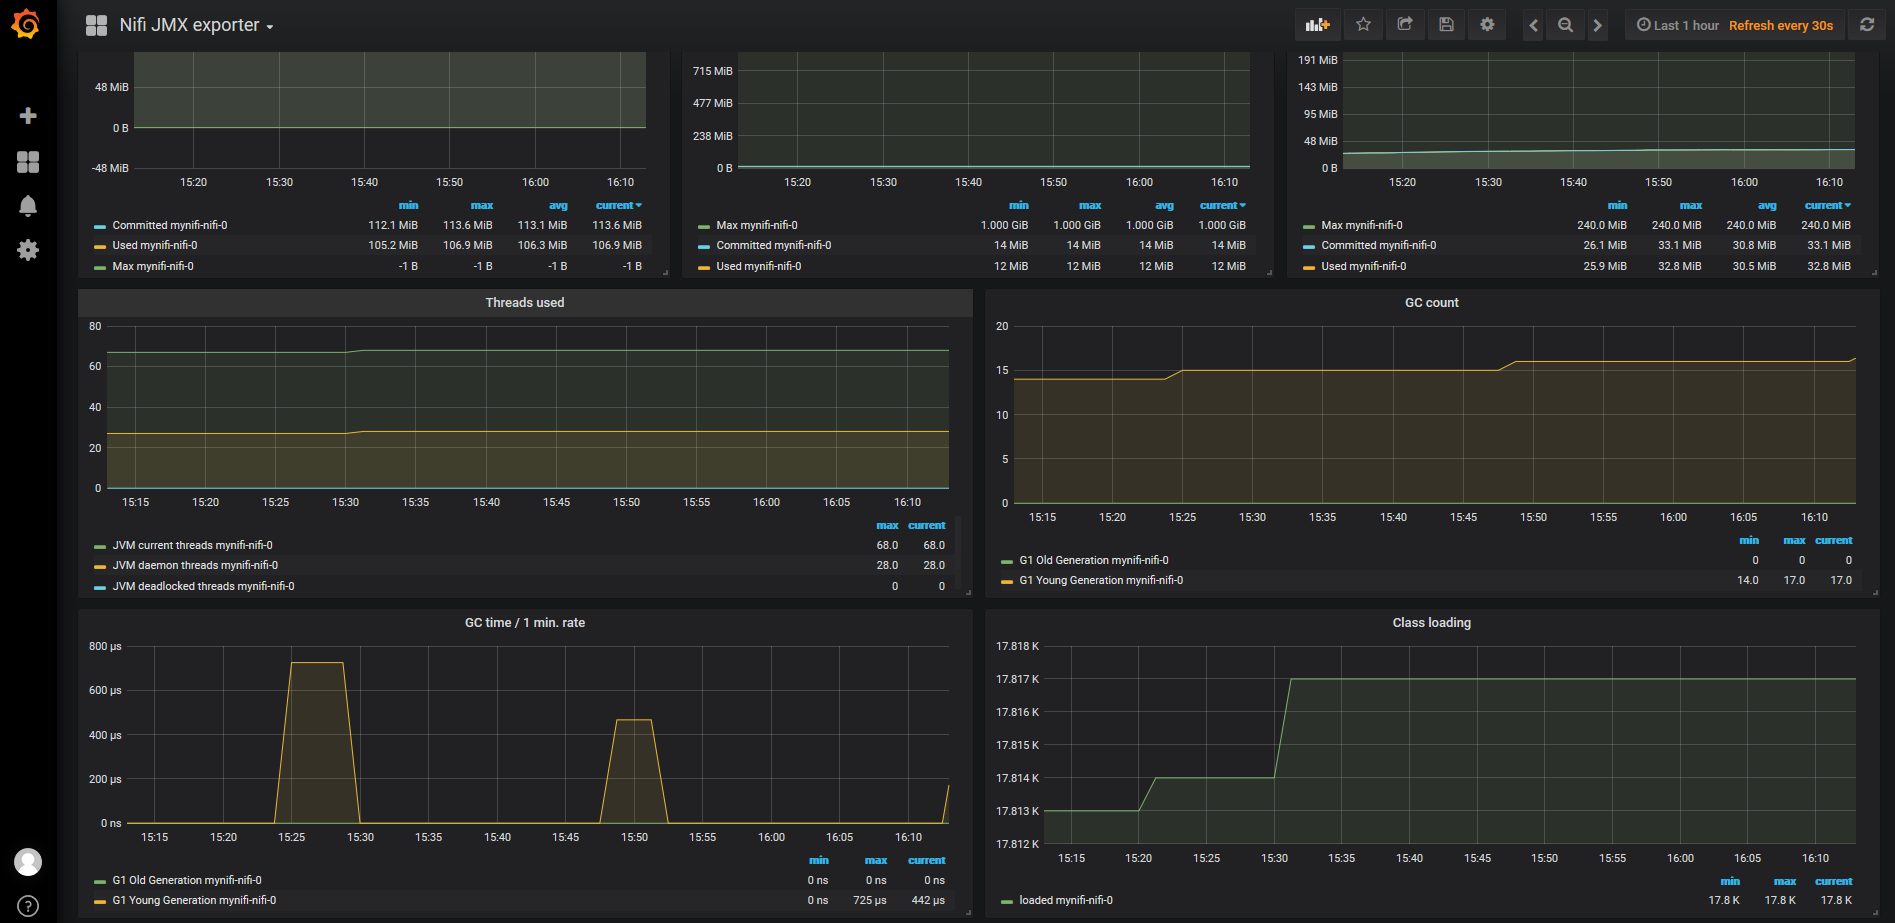
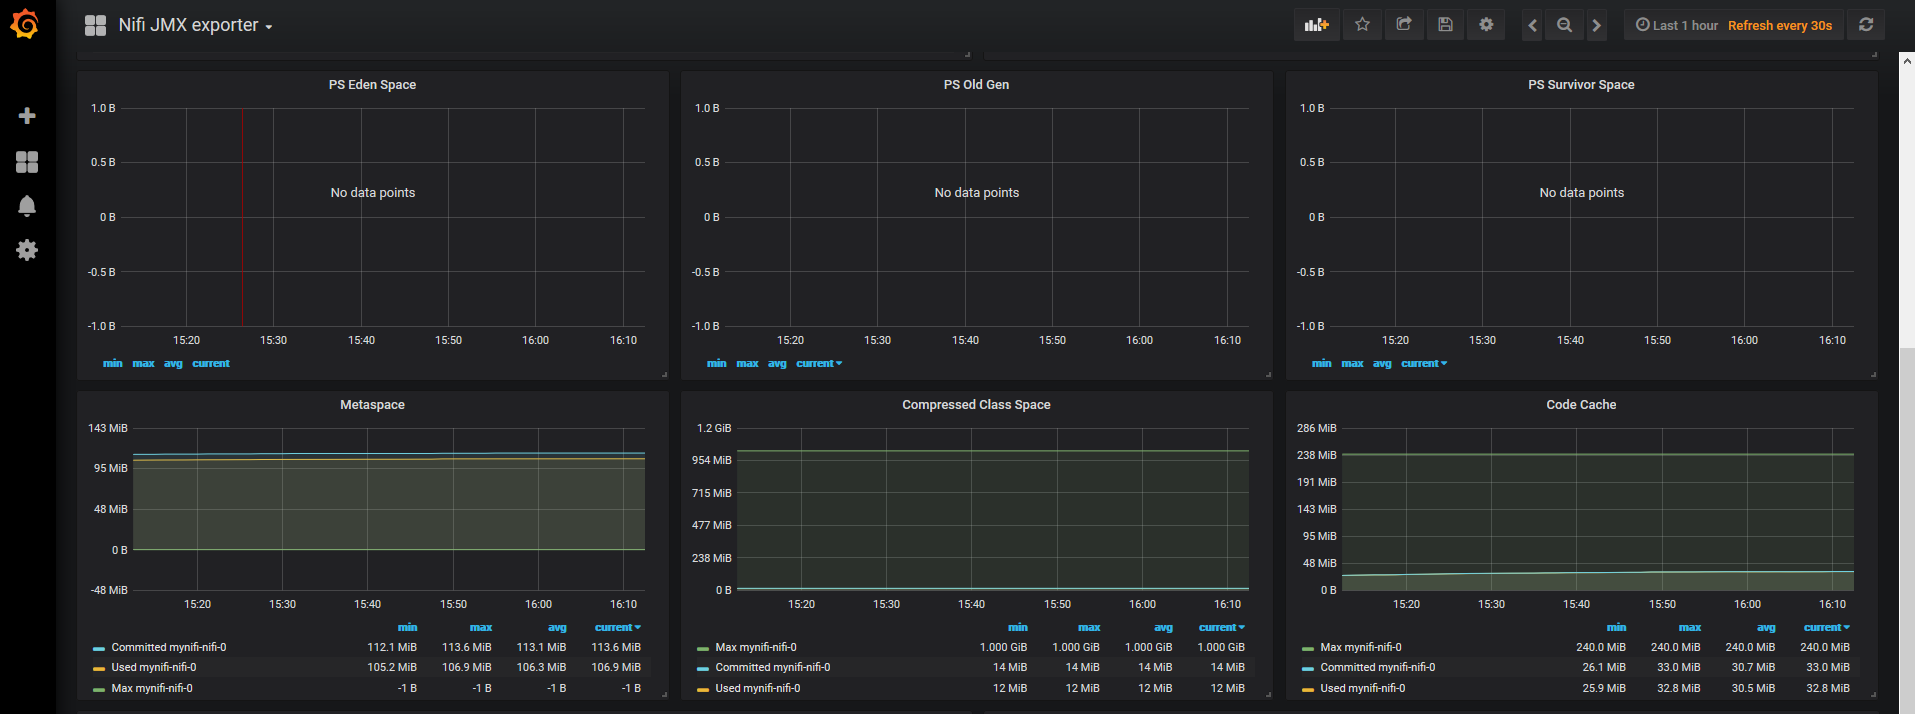
Complete dashboard using metrics from prometheus JMX exporter, with drill down per NiFi release > pod
Screenshots
Used Metrics 1313
jvm_classes_loaded
jvm_gc_collection_seconds_count
jvm_gc_collection_seconds_sum
jvm_info
jvm_memory_bytes_max
jvm_memory_bytes_used
jvm_memory_pool_bytes_committed
jvm_memory_pool_bytes_max
jvm_memory_pool_bytes_used
jvm_threads_current
jvm_threads_daemon
jvm_threads_deadlocked
-
process_start_time_seconds
Get Dashboard✕
Download
Copy to Clipboard