Nginx VTS Stats 40,18640,186 4.3 (3 reviews)
8/16/2017
3/6/2018
2
Web Servers
>=4.0.2
Prometheus
Description
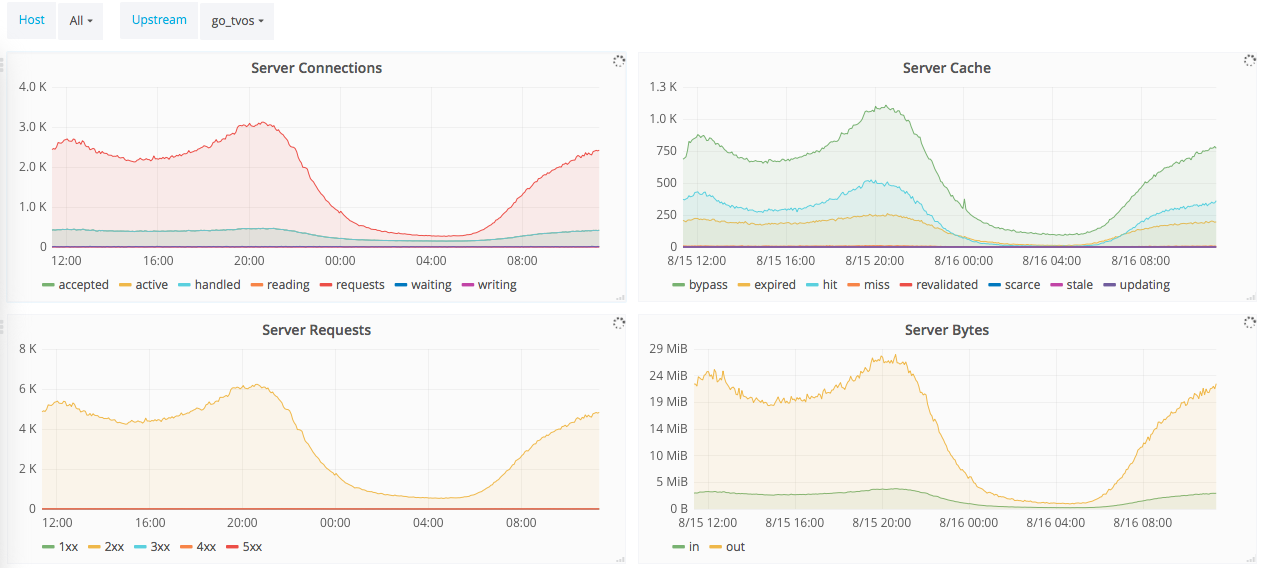
Monitors Nginx VTS statistics by visualizing per-second activity and resource usage to assess reverse proxy performance and request handling. Key metrics typically include nginx_vts_server_requests_total, nginx_vts_server_connections_active, and nginx_vts_server_bytes_out to track request throughput, concurrent connections, and egress traffic, enabling latency and saturation analysis. Includes time-series panels for real-time trends, built-in thresholds, and alerting to detect overloads or bottlenecks.
Screenshots
Get Dashboard✕
Download
Copy to Clipboard