NGINX Log Metrics [M] 1,2511,251 5.0 (1 reviews)
3/17/2022
3/17/2022
1
Web Servers
>=8.5.0-54880pre
Prometheus
Description
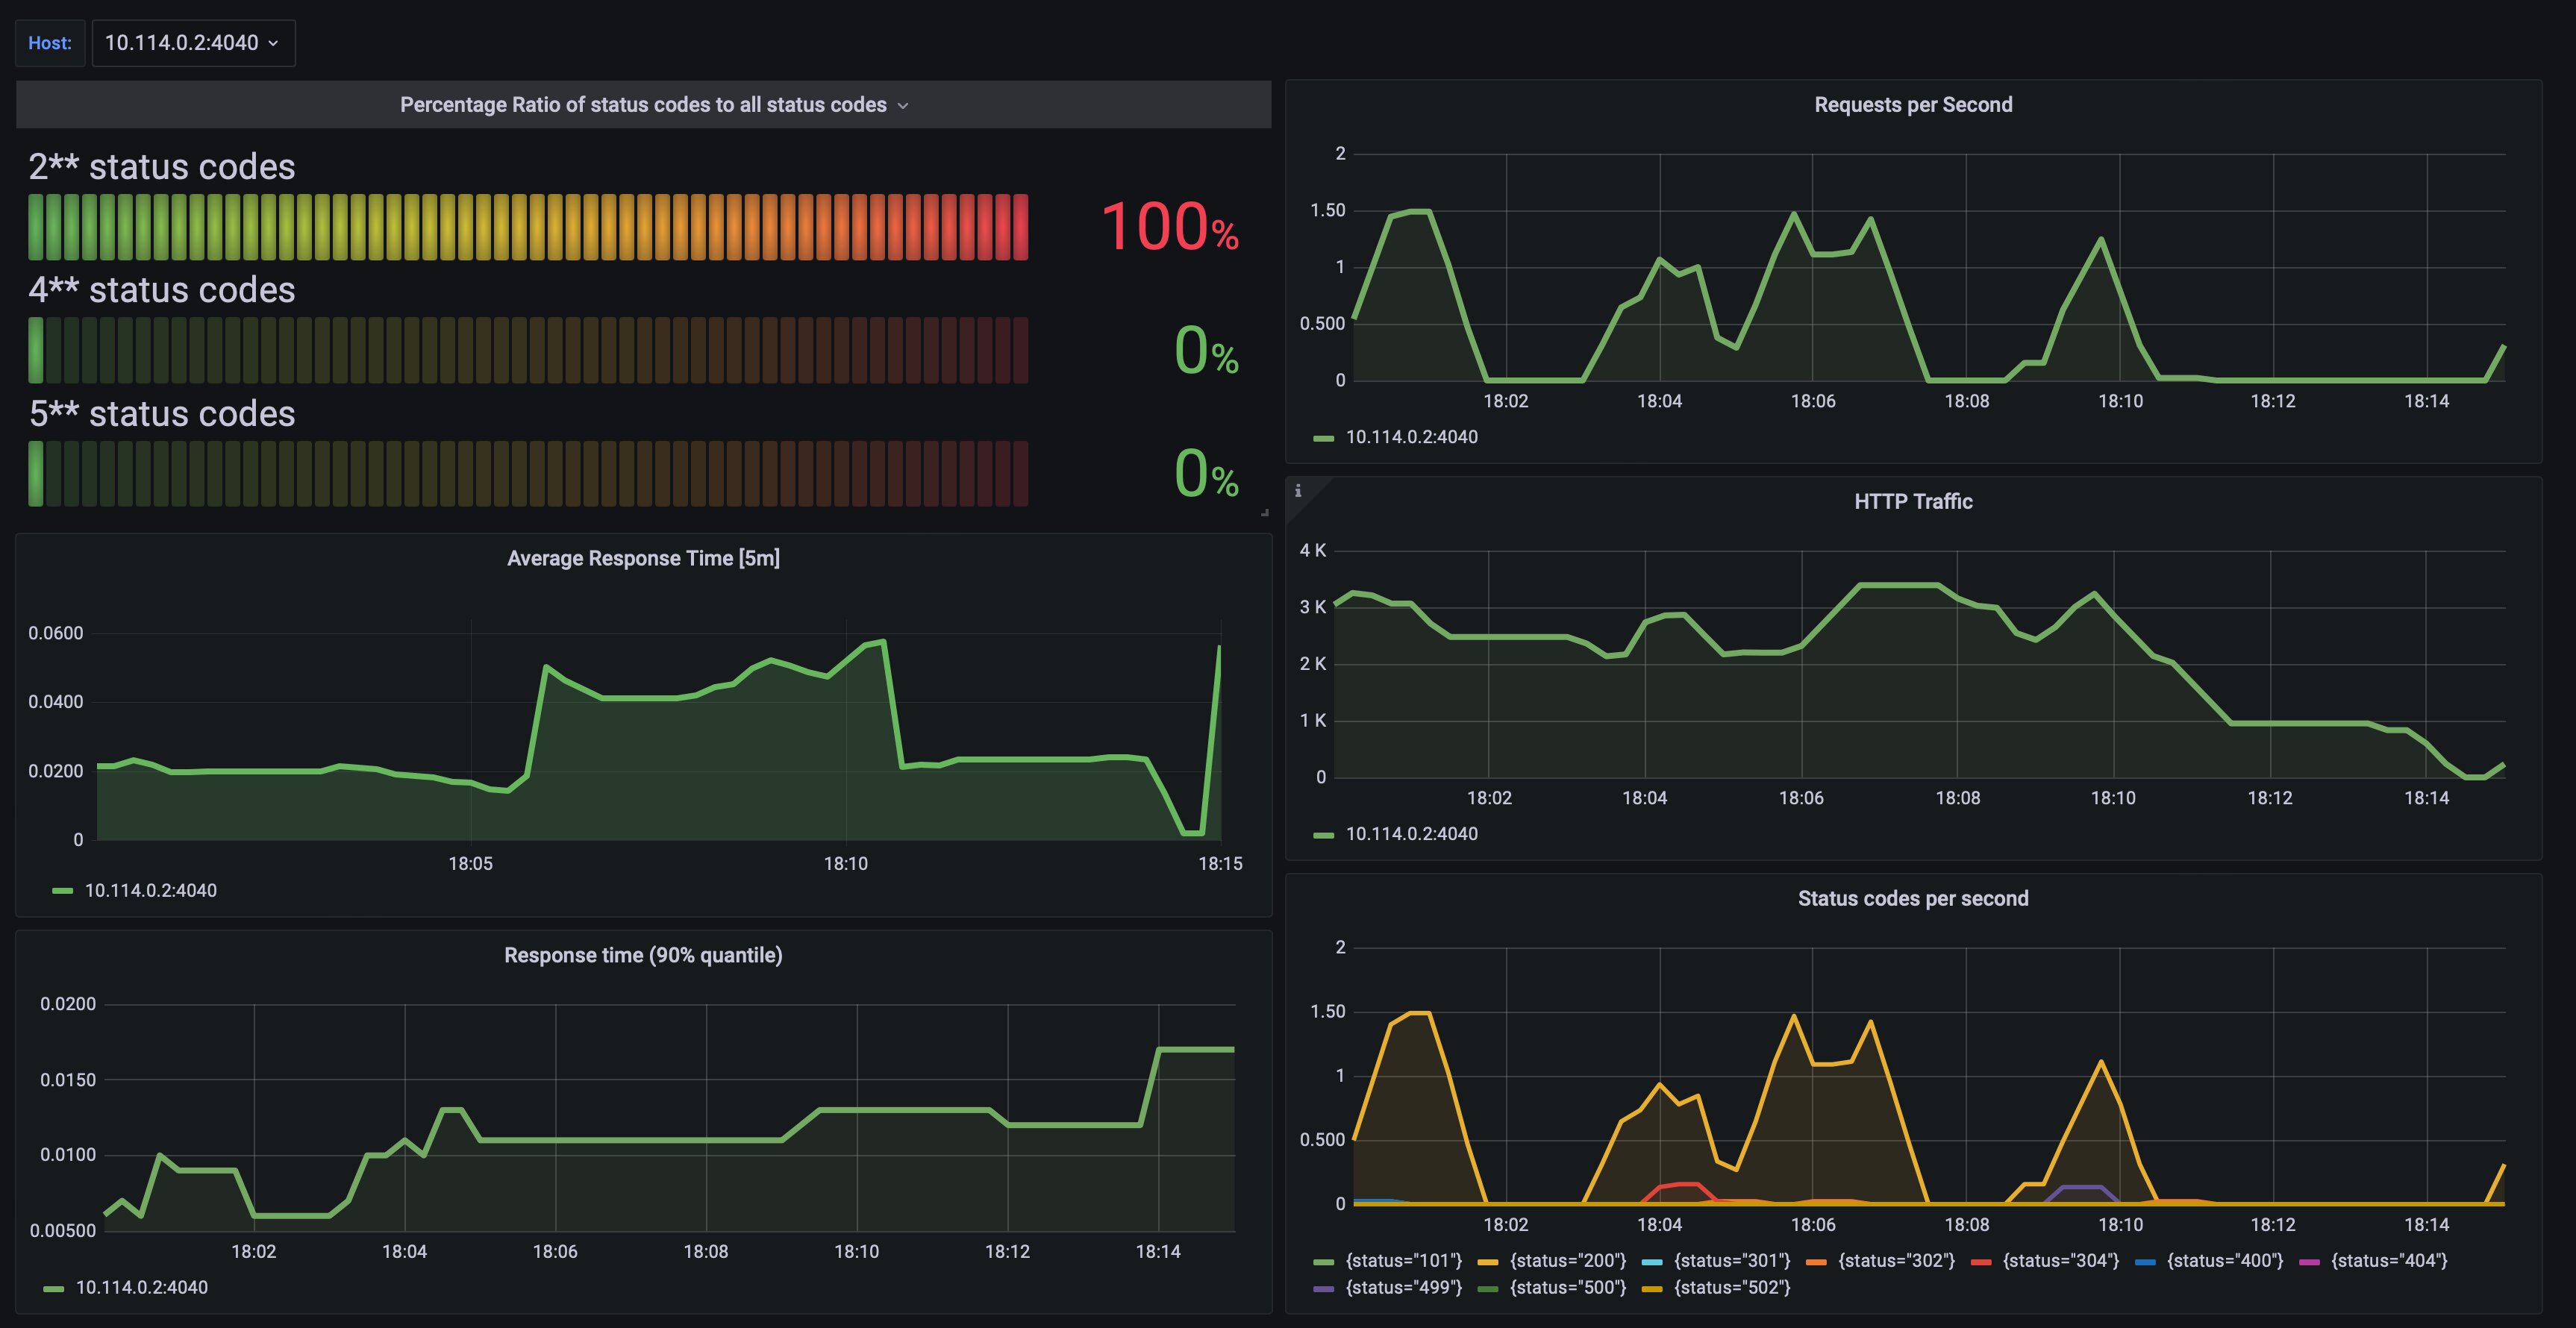
NGINX Log metrics with Prometheus based on https://github.com/martin-helmich/prometheus-nginxlog-exporter Based on namespace prefix 'nginx'. If different, you may need to adjust the metrics. Dashboard based on 6482 dashboard
Screenshots
Used Metrics 55
nginx_http_response_count_total
nginx_http_response_size_bytes
nginx_http_response_time_seconds
nginx_http_response_time_seconds_count
nginx_http_response_time_seconds_sum
Get Dashboard✕
Download
Copy to Clipboard