NGINX Ingress controller 96,23996,239
Description
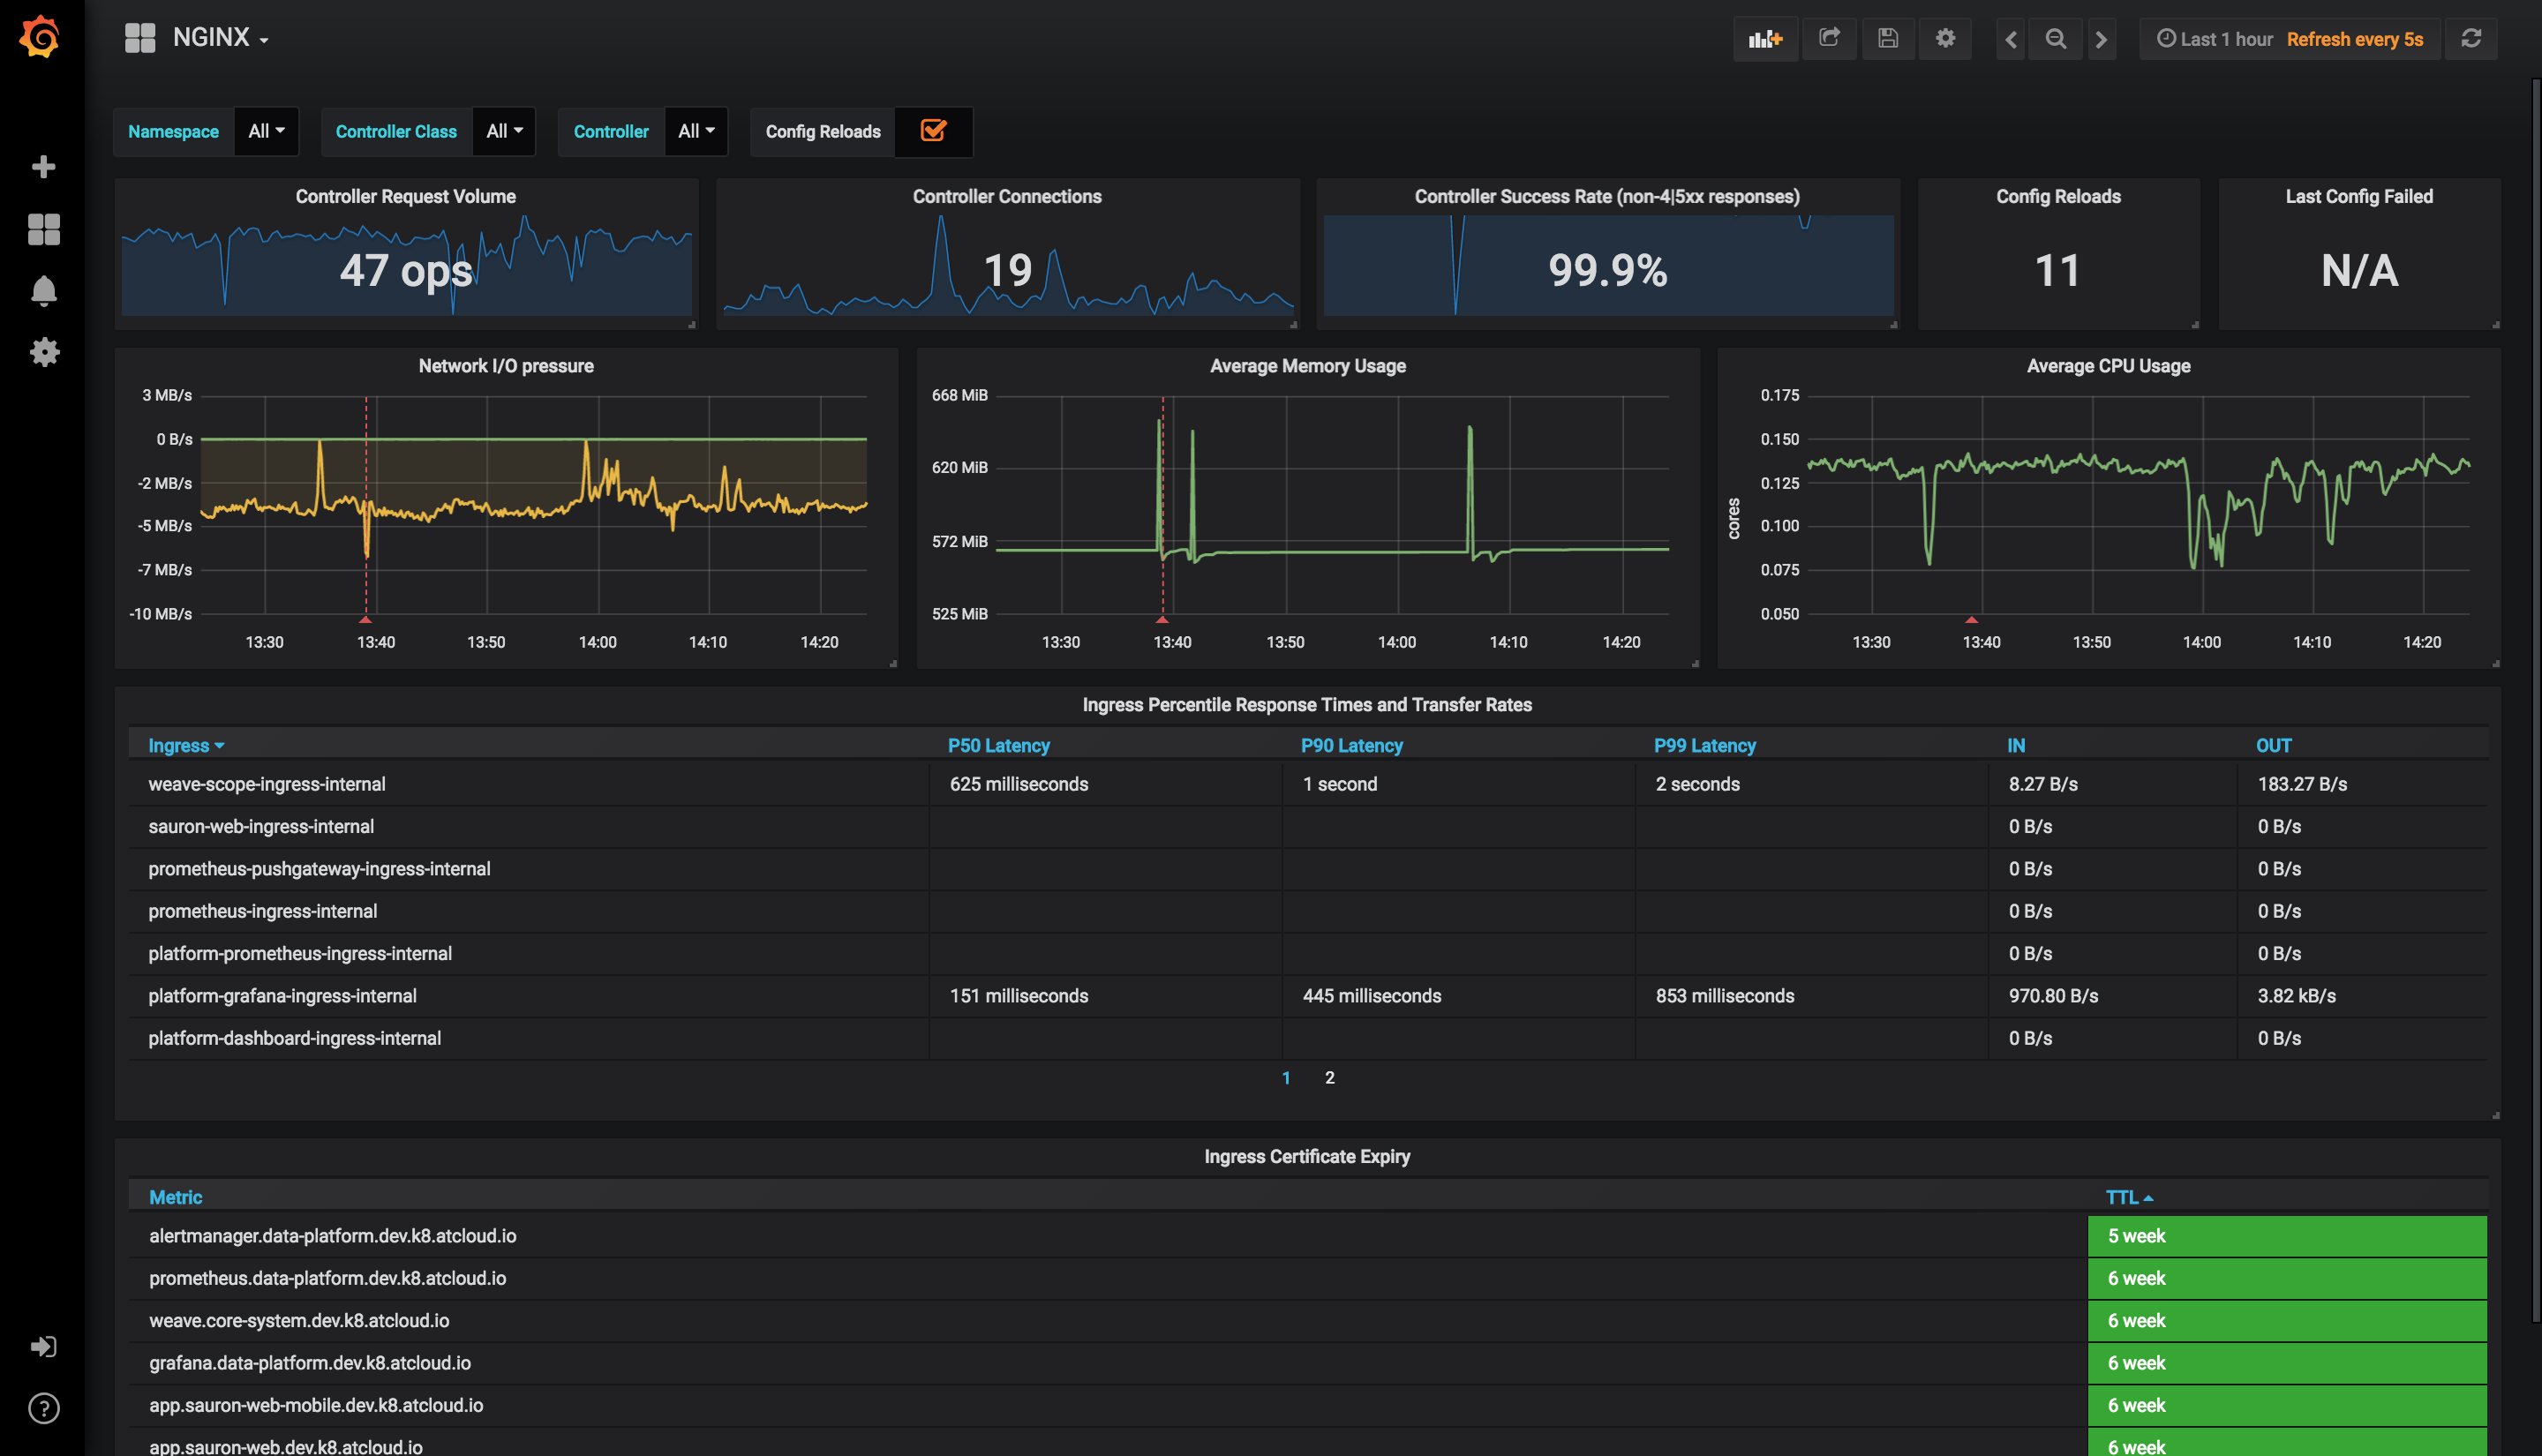
This dashboard monitors the health and performance of an NGINX Ingress controller, focusing on request handling, error rate, and resource usage. It highlights detailed metrics like nginx_ingress_controller_requests and nginx_ingress_controller_success for traffic and non-4xx/5xx outcomes, config reload status, and resource utilization through nginx_ingress_controller_nginx_process_connections, nginx_ingress_controller_nginx_process_resident_memory_bytes, and nginx_ingress_controller_nginx_process_cpu_seconds_total. Additional features include percentile and latency visualizations, transfer rates, and certificate expiry monitoring to ensure SLA adherence and secure operations.
Screenshots

Used Metrics 1010
nginx_ingress_controller_config_last_reload_successful
nginx_ingress_controller_nginx_process_connections
nginx_ingress_controller_nginx_process_cpu_seconds_total
nginx_ingress_controller_nginx_process_resident_memory_bytes
nginx_ingress_controller_request_duration_seconds_bucket
nginx_ingress_controller_request_size_sum
nginx_ingress_controller_requests
nginx_ingress_controller_response_size_sum
nginx_ingress_controller_ssl_expire_time_seconds
nginx_ingress_controller_success