NGINX Ingress controller 37,04837,048
6/17/2024
6/17/2024
1
>=10.4.3
Prometheus
Description
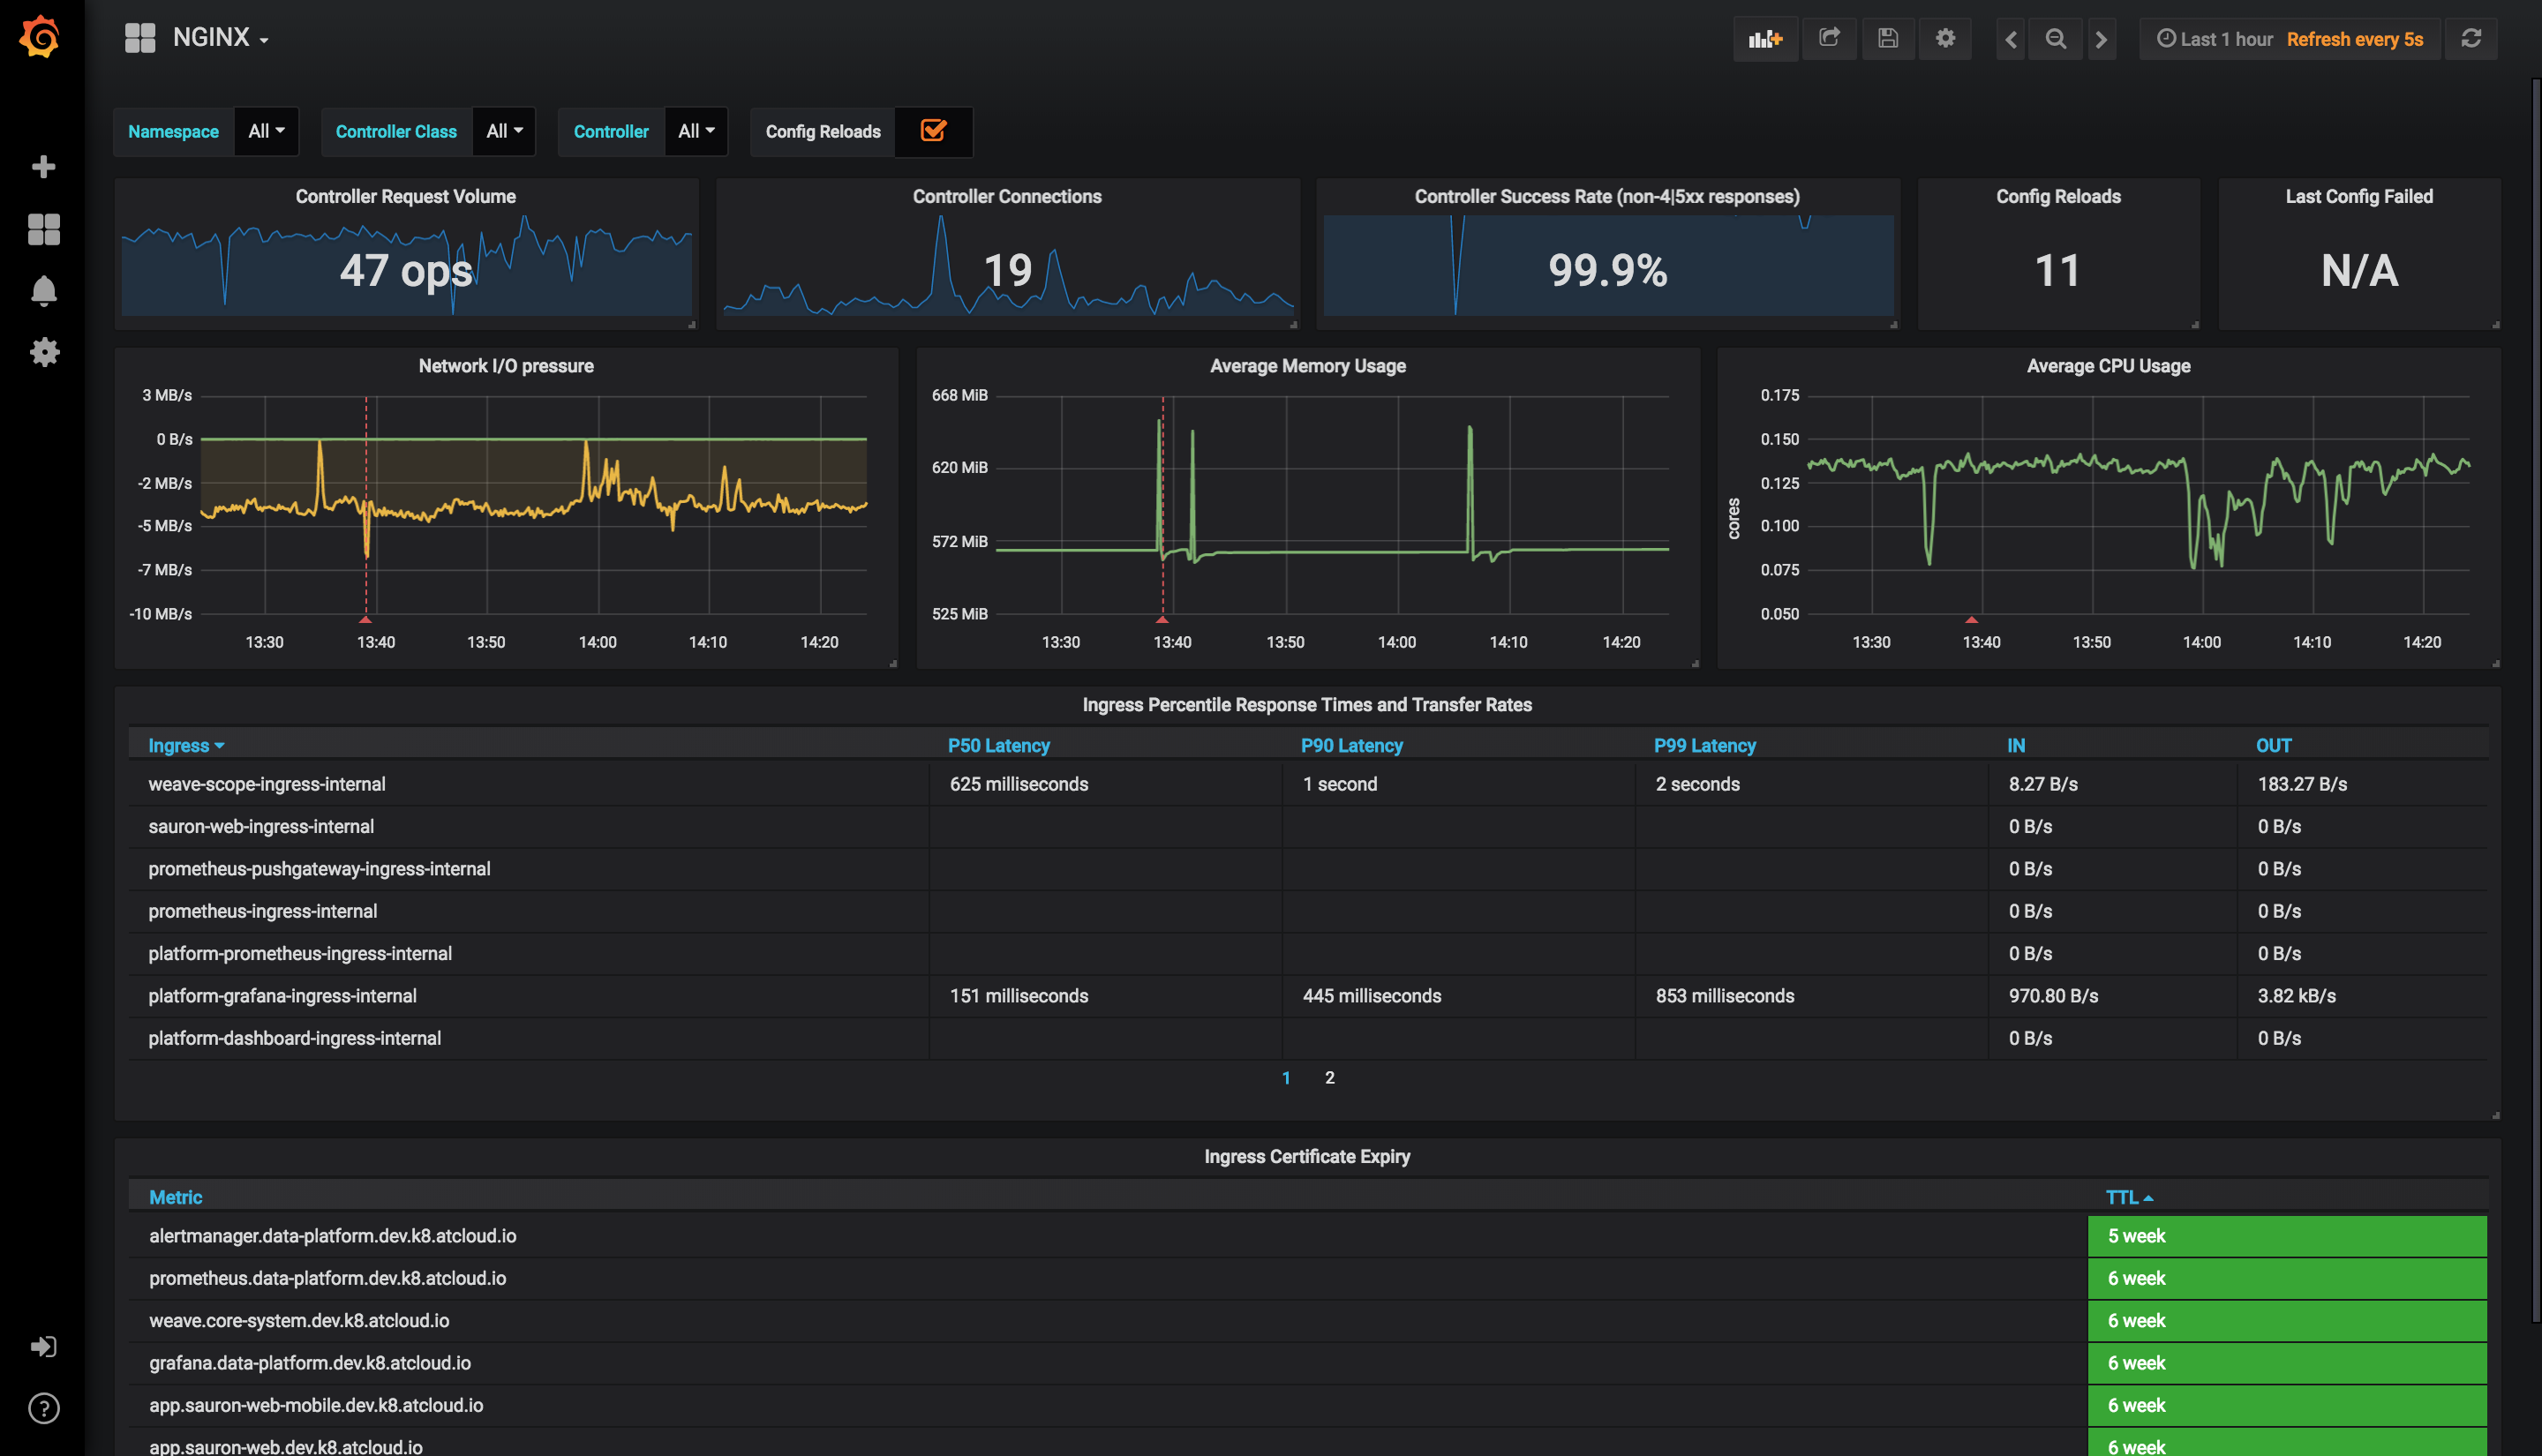
NGINX Ingress controller
Screenshots
Used Metrics 1010
nginx_ingress_controller_config_last_reload_successful
nginx_ingress_controller_nginx_process_connections
nginx_ingress_controller_nginx_process_cpu_seconds_total
nginx_ingress_controller_nginx_process_resident_memory_bytes
nginx_ingress_controller_request_duration_seconds_bucket
nginx_ingress_controller_request_size_sum
nginx_ingress_controller_requests
nginx_ingress_controller_response_size_sum
nginx_ingress_controller_ssl_expire_time_seconds
nginx_ingress_controller_success
Get Dashboard✕
Download
Copy to Clipboard