NGINX by nginxinc 7,3837,383
11/15/2019
11/15/2019
1
>=5.0.0
Prometheus
Description
Official dashboard for NGINX Prometheus exporter
Screenshots
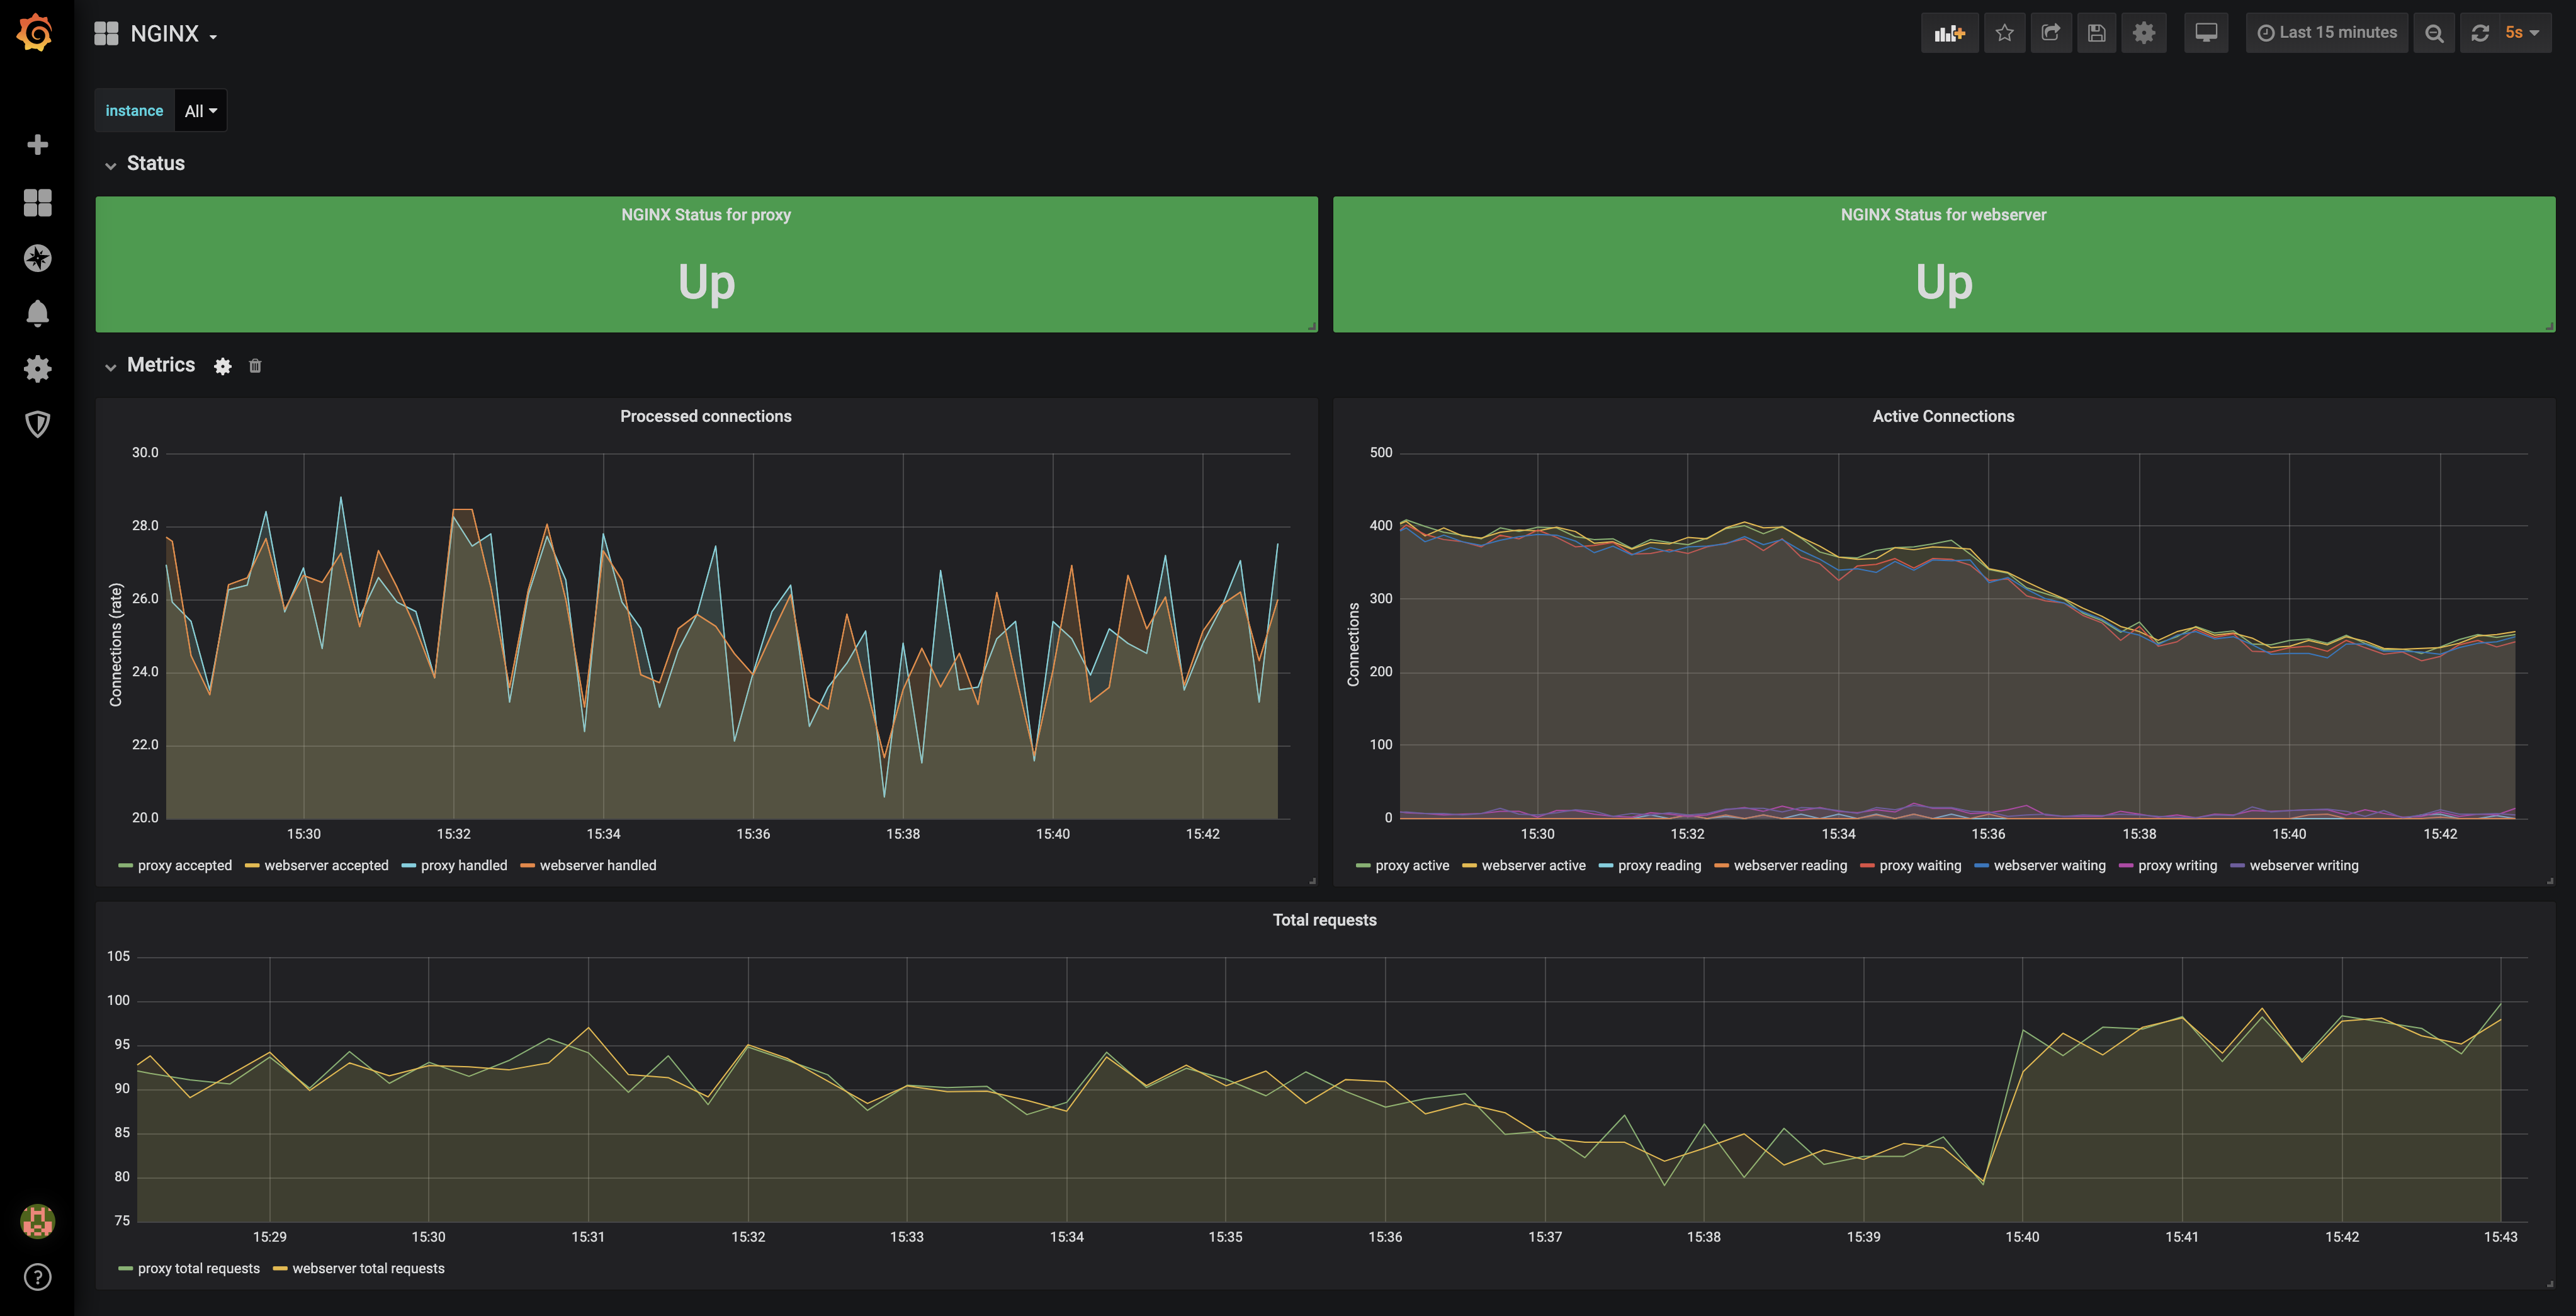
Used Metrics 88
nginx_connections_accepted
nginx_connections_active
nginx_connections_handled
nginx_connections_reading
nginx_connections_waiting
nginx_connections_writing
nginx_http_requests_total
nginx_up
Get Dashboard✕
Download
Copy to Clipboard