NGINX 63,89263,892
Description
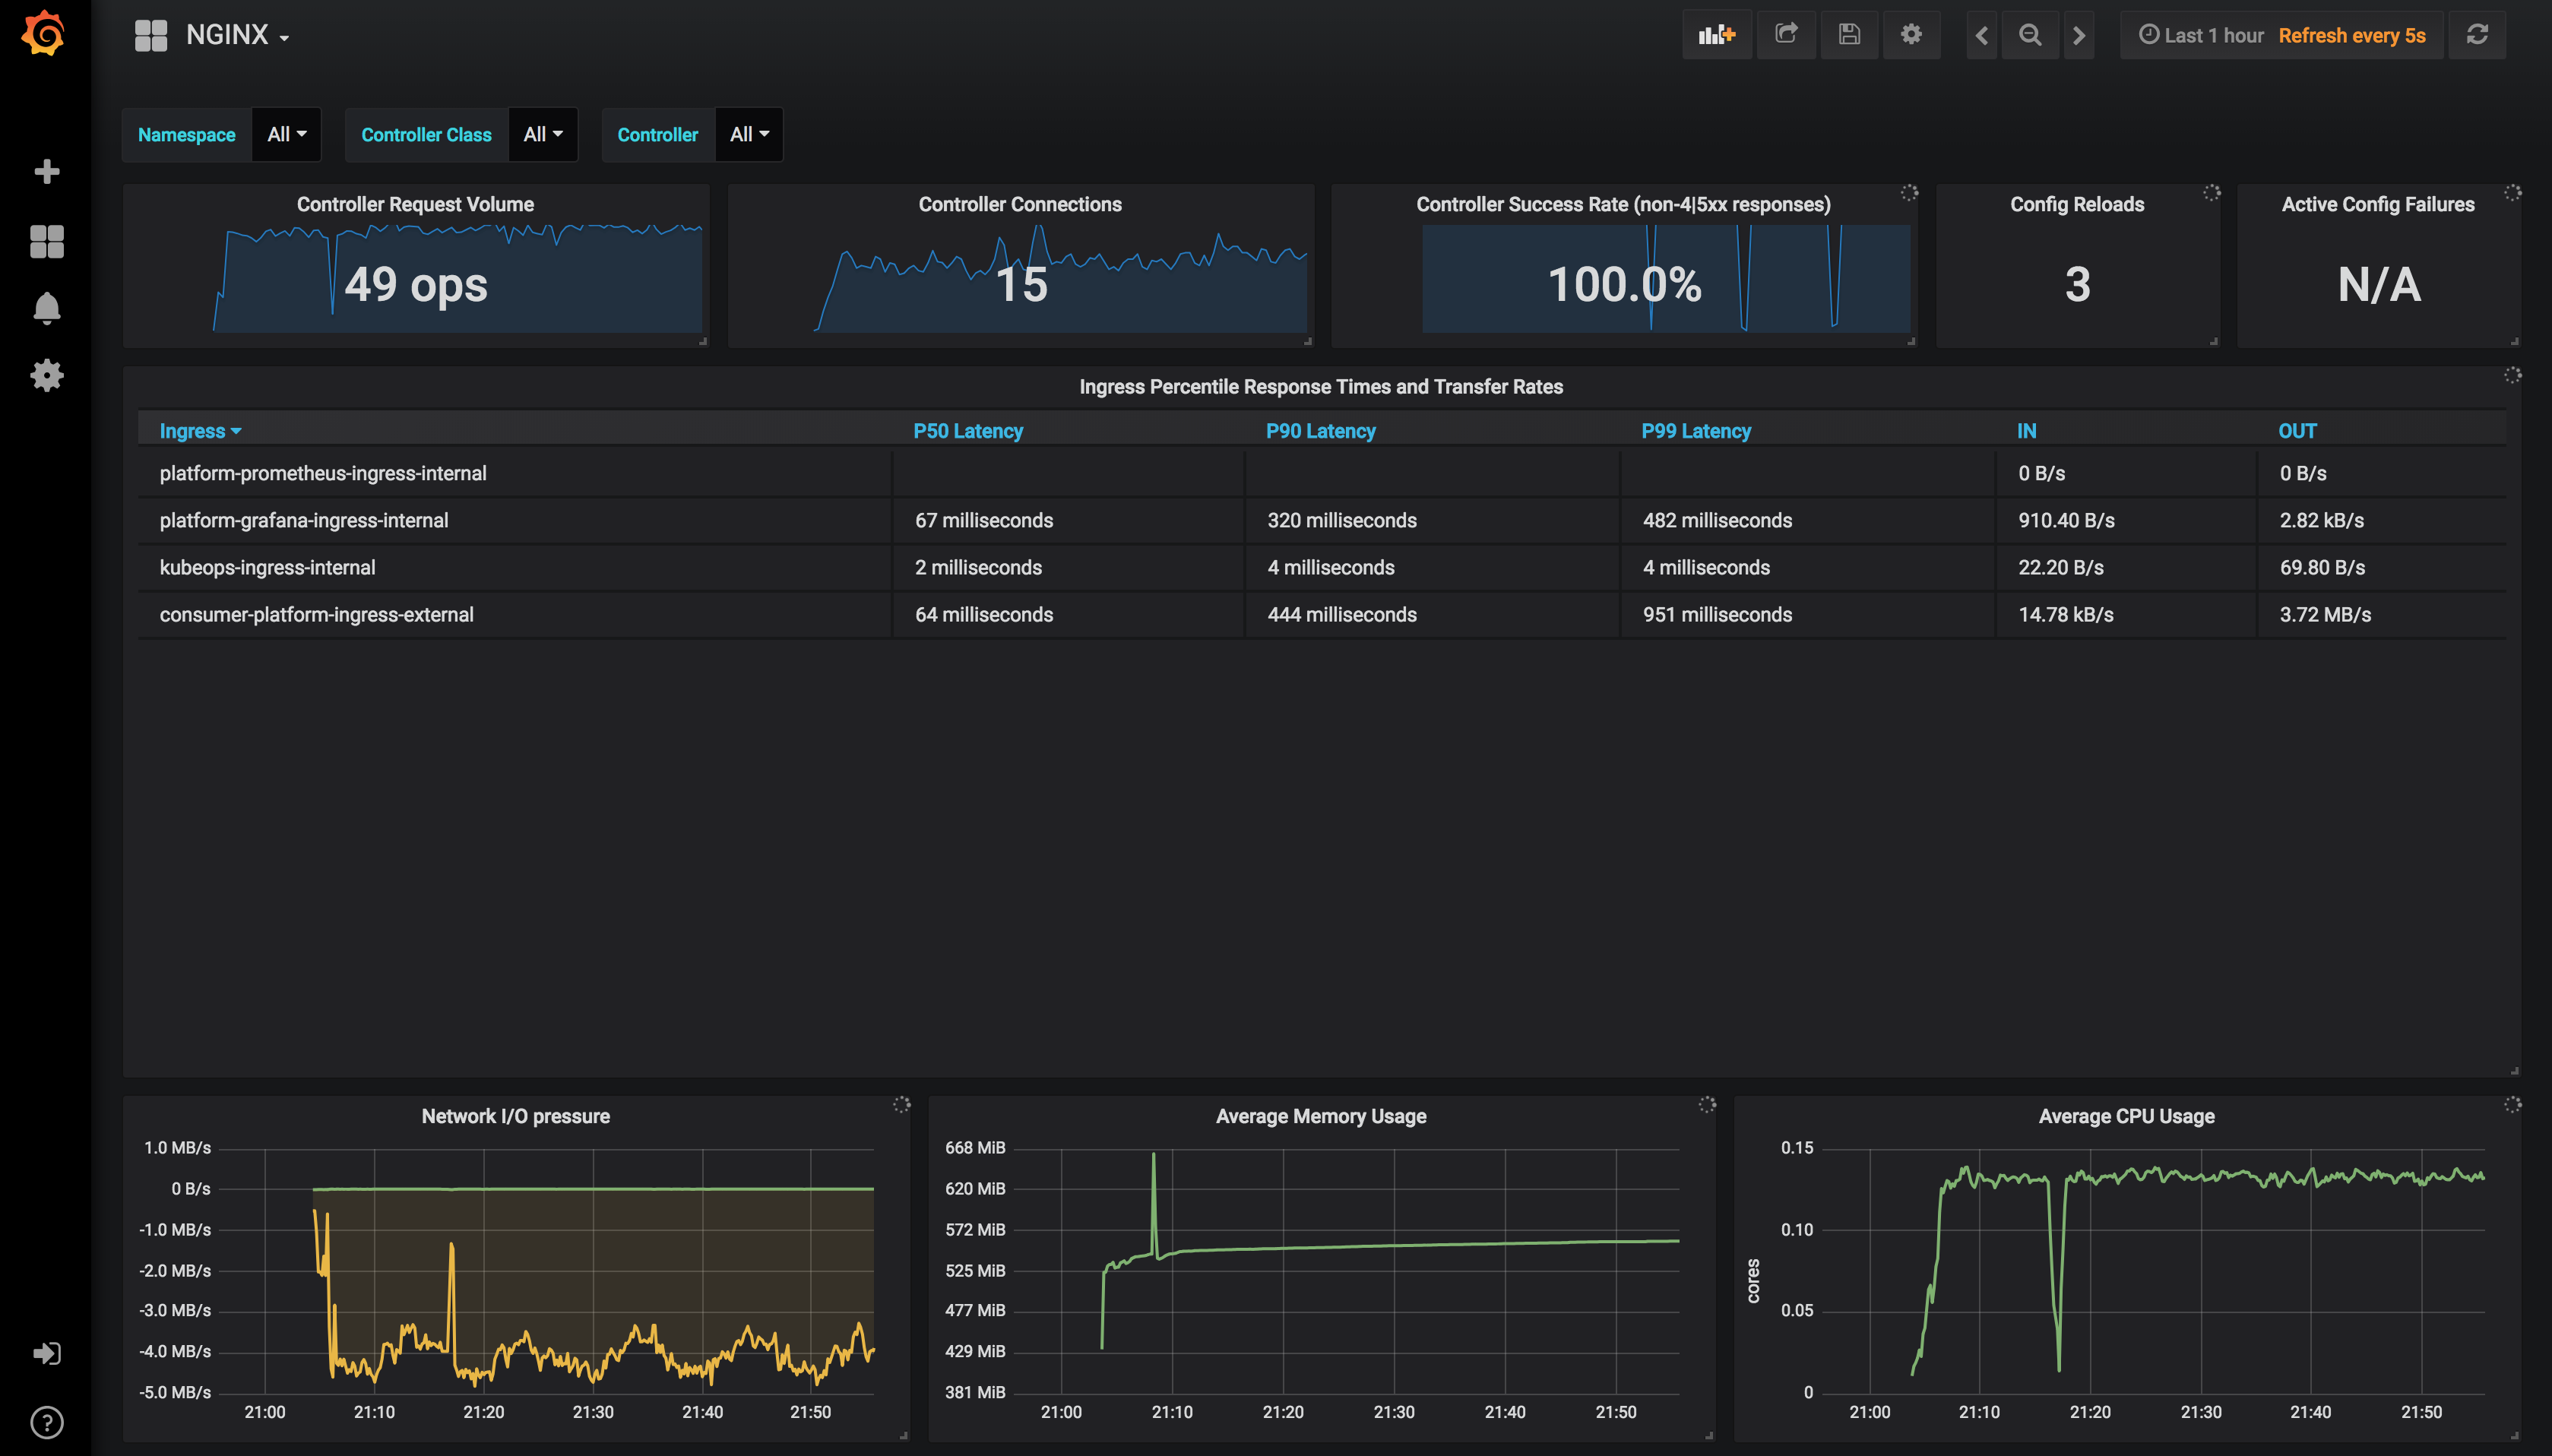
Monitors the health, performance, and reliability of the NGINX Ingress Controller, focusing on request volume, connection handling, and error/response characteristics. *Key metrics include nginx_ingress_controller_requests for throughput, nginx_ingress_controller_success for success rate (excluding 4xx/5xx), and nginx_ingress_controller_request_duration_seconds_bucket for latency distribution, complemented by memory, CPU, and config reload indicators to track resource usage and configurational integrity.
Screenshots
Used Metrics 99
nginx_ingress_controller_config_last_reload_successful
nginx_ingress_controller_nginx_process_connections
nginx_ingress_controller_nginx_process_cpu_seconds_total
nginx_ingress_controller_nginx_process_resident_memory_bytes
nginx_ingress_controller_request_duration_seconds_bucket
nginx_ingress_controller_request_size_sum
nginx_ingress_controller_requests
nginx_ingress_controller_response_size_sum
nginx_ingress_controller_success