Nginx 20,806,75720,806,757 5.0 (1 reviews)
Description
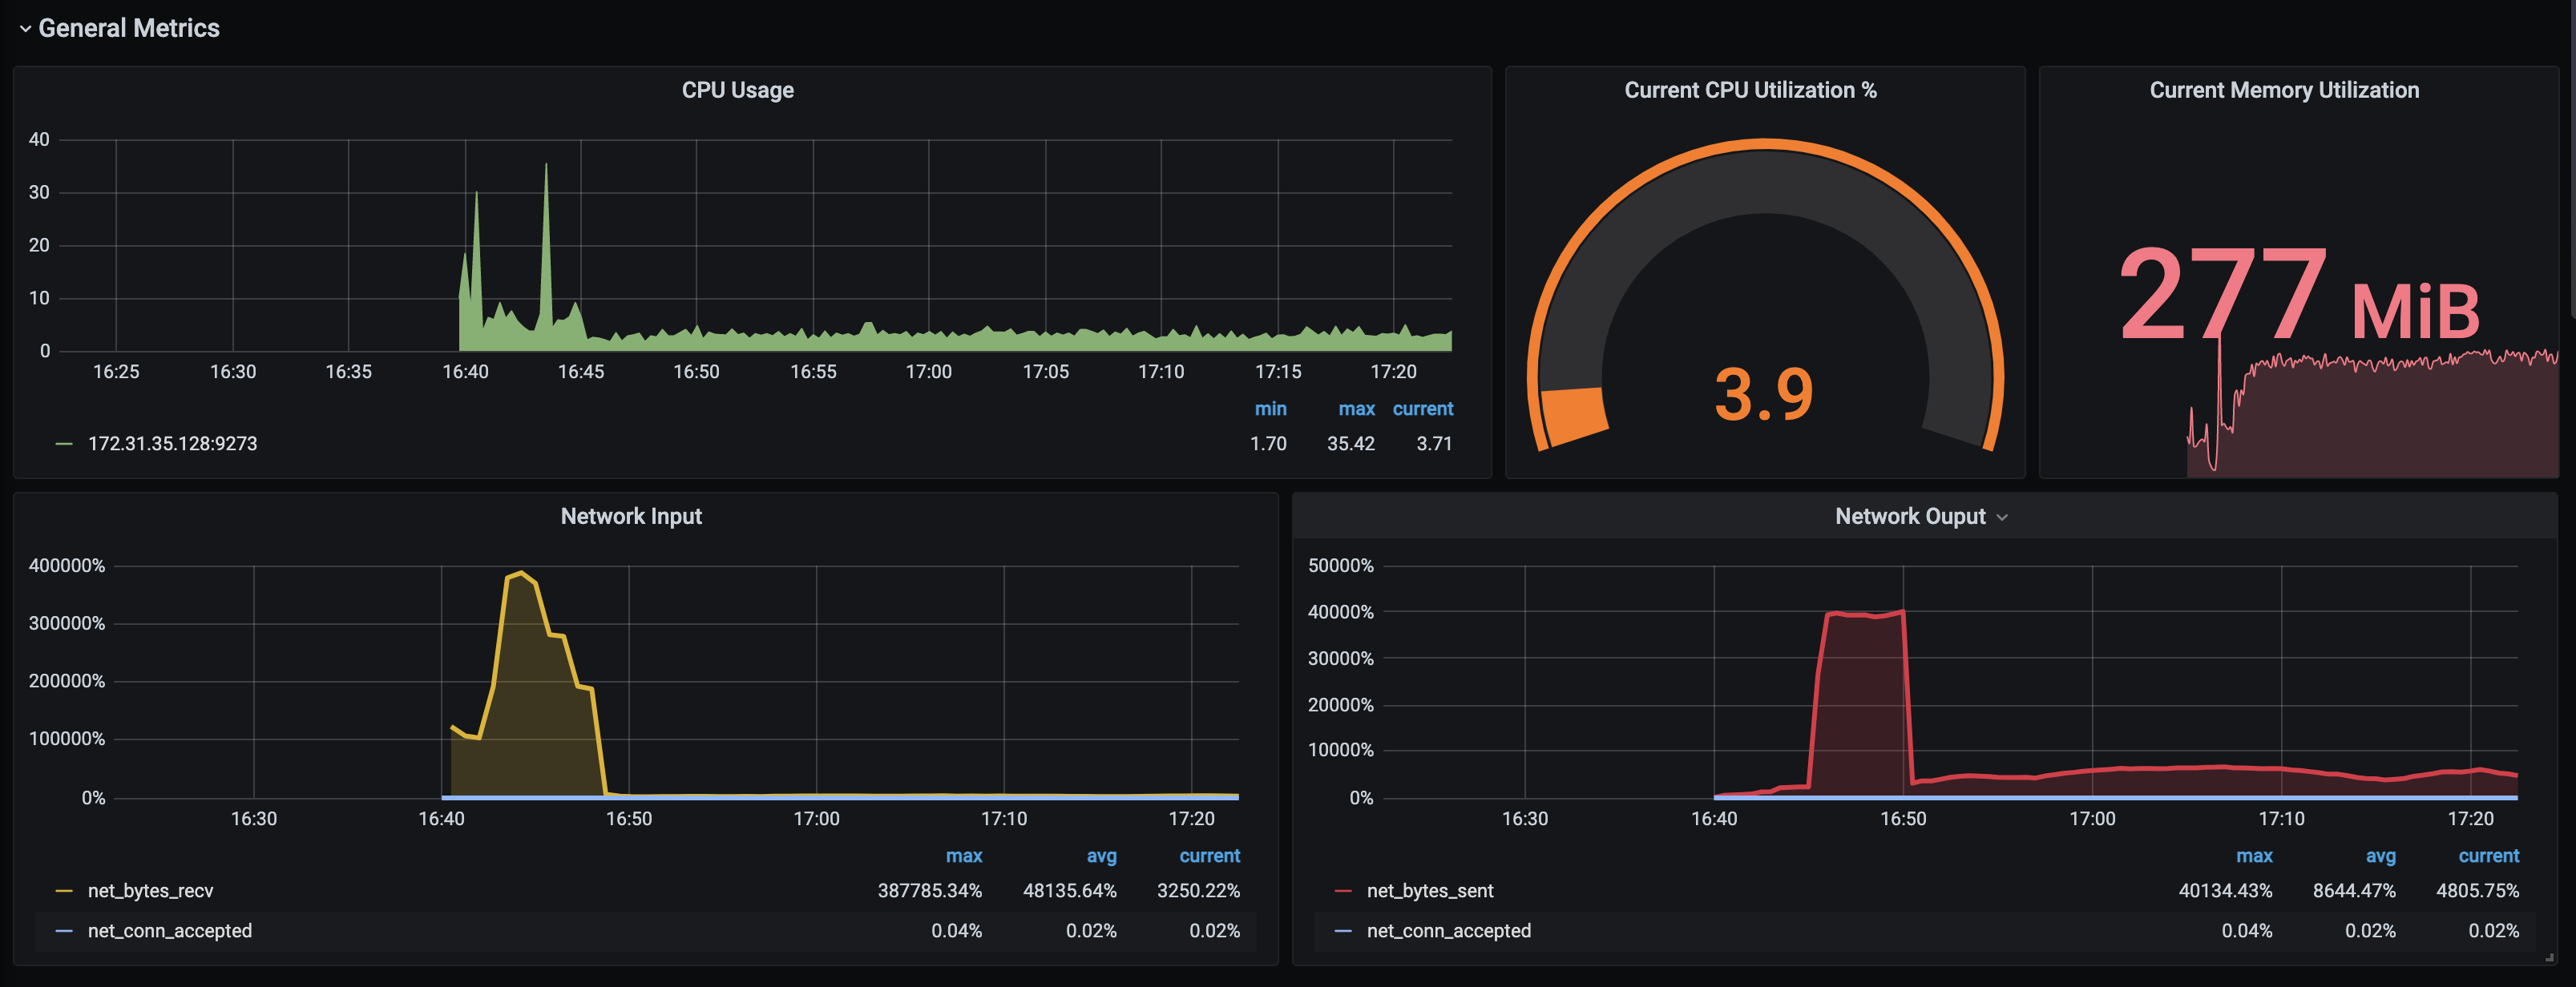
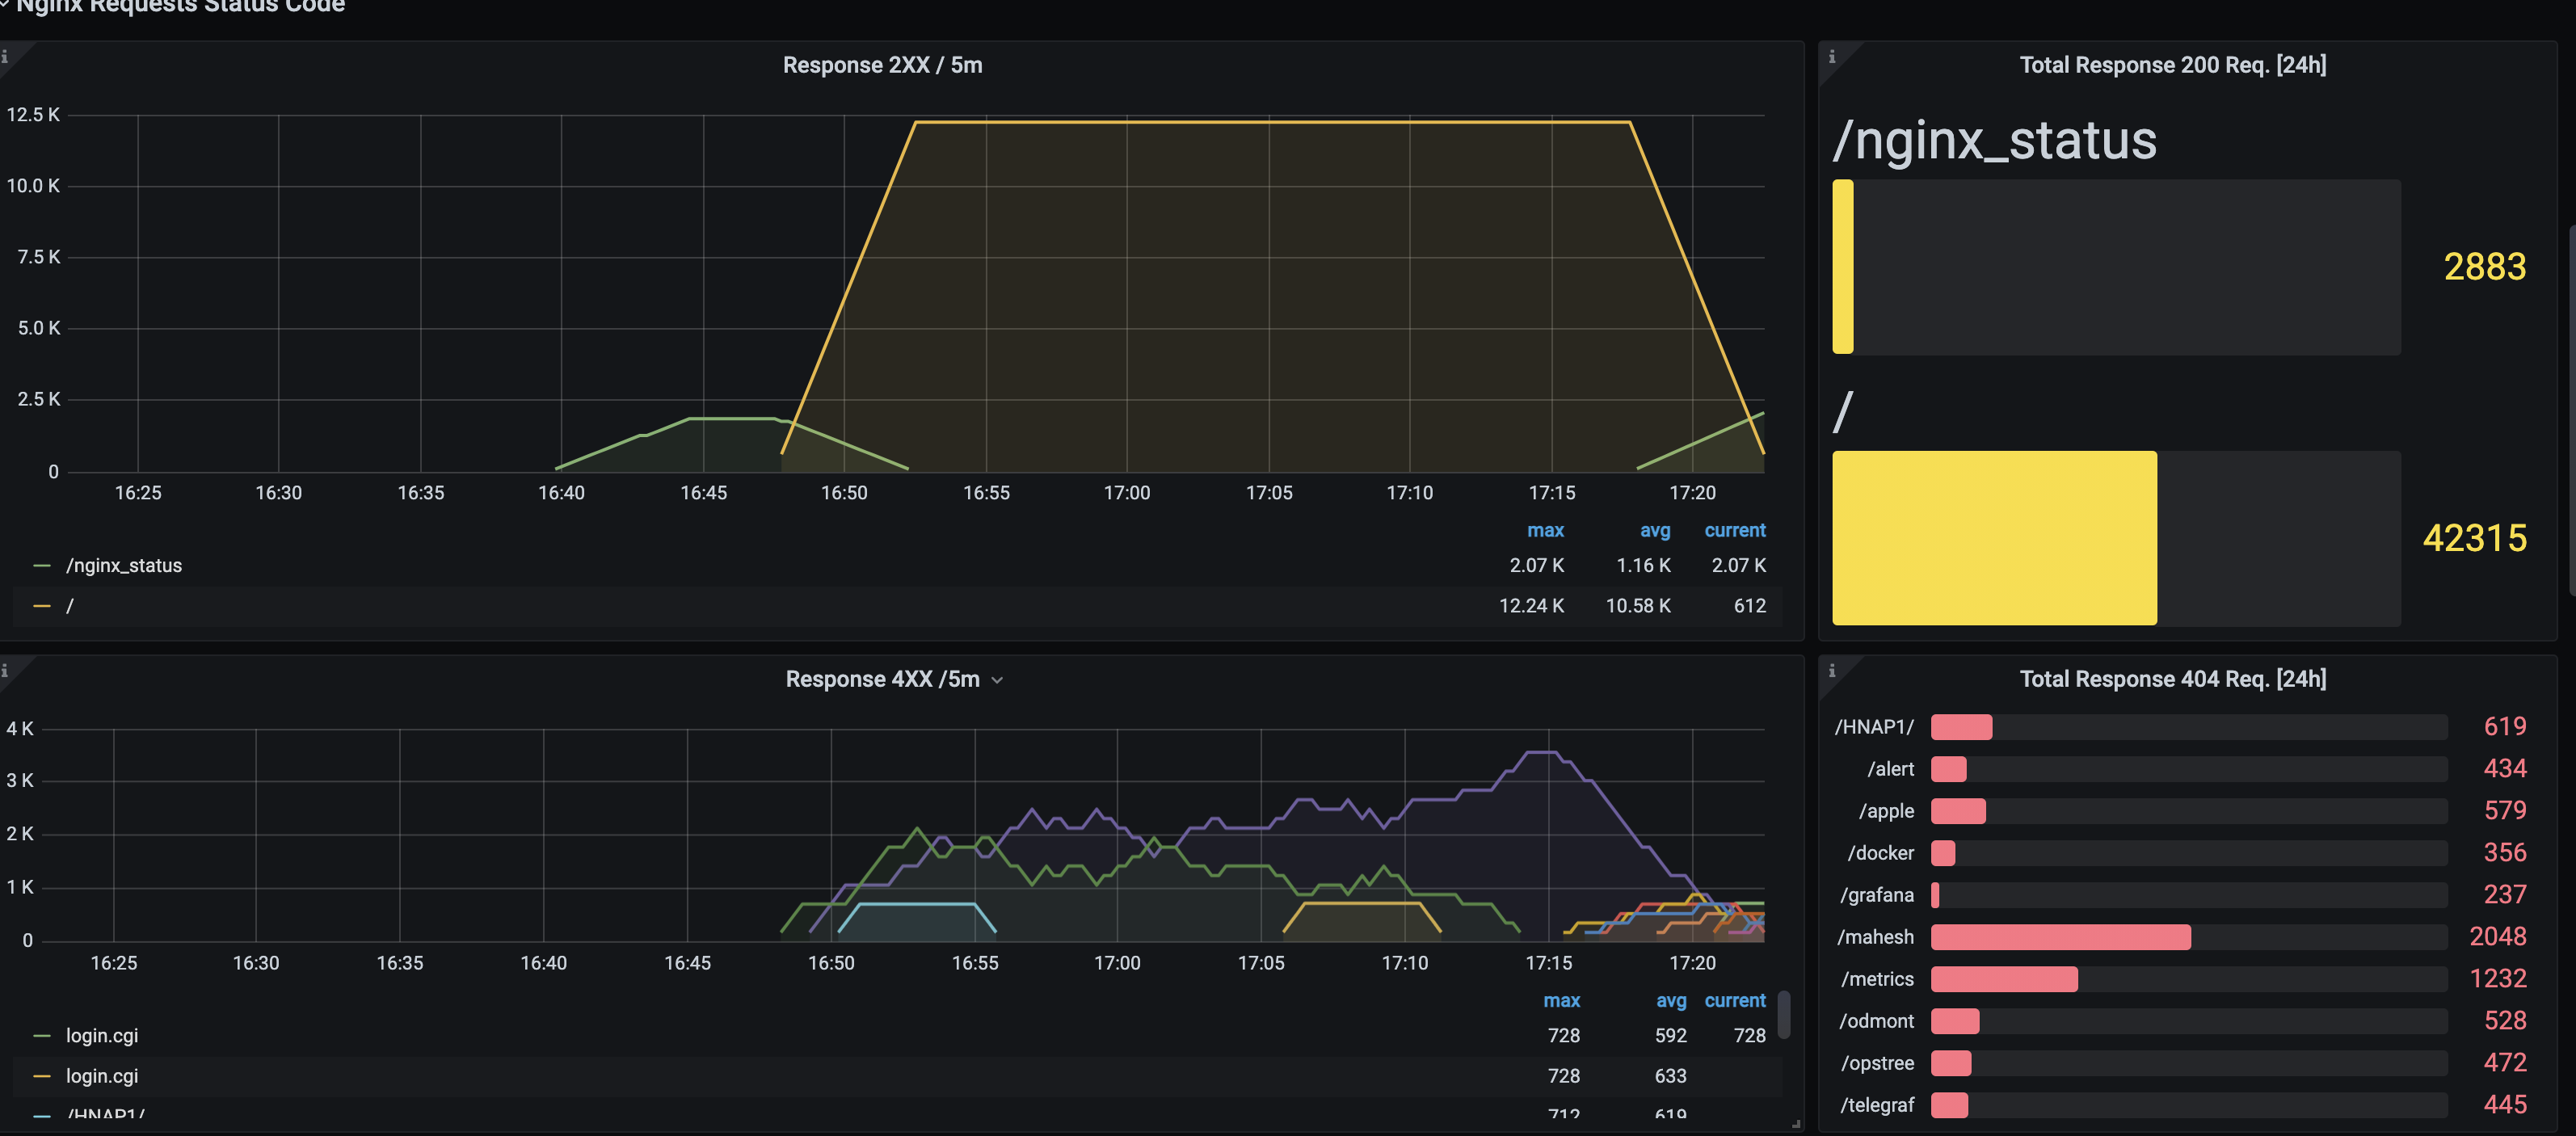
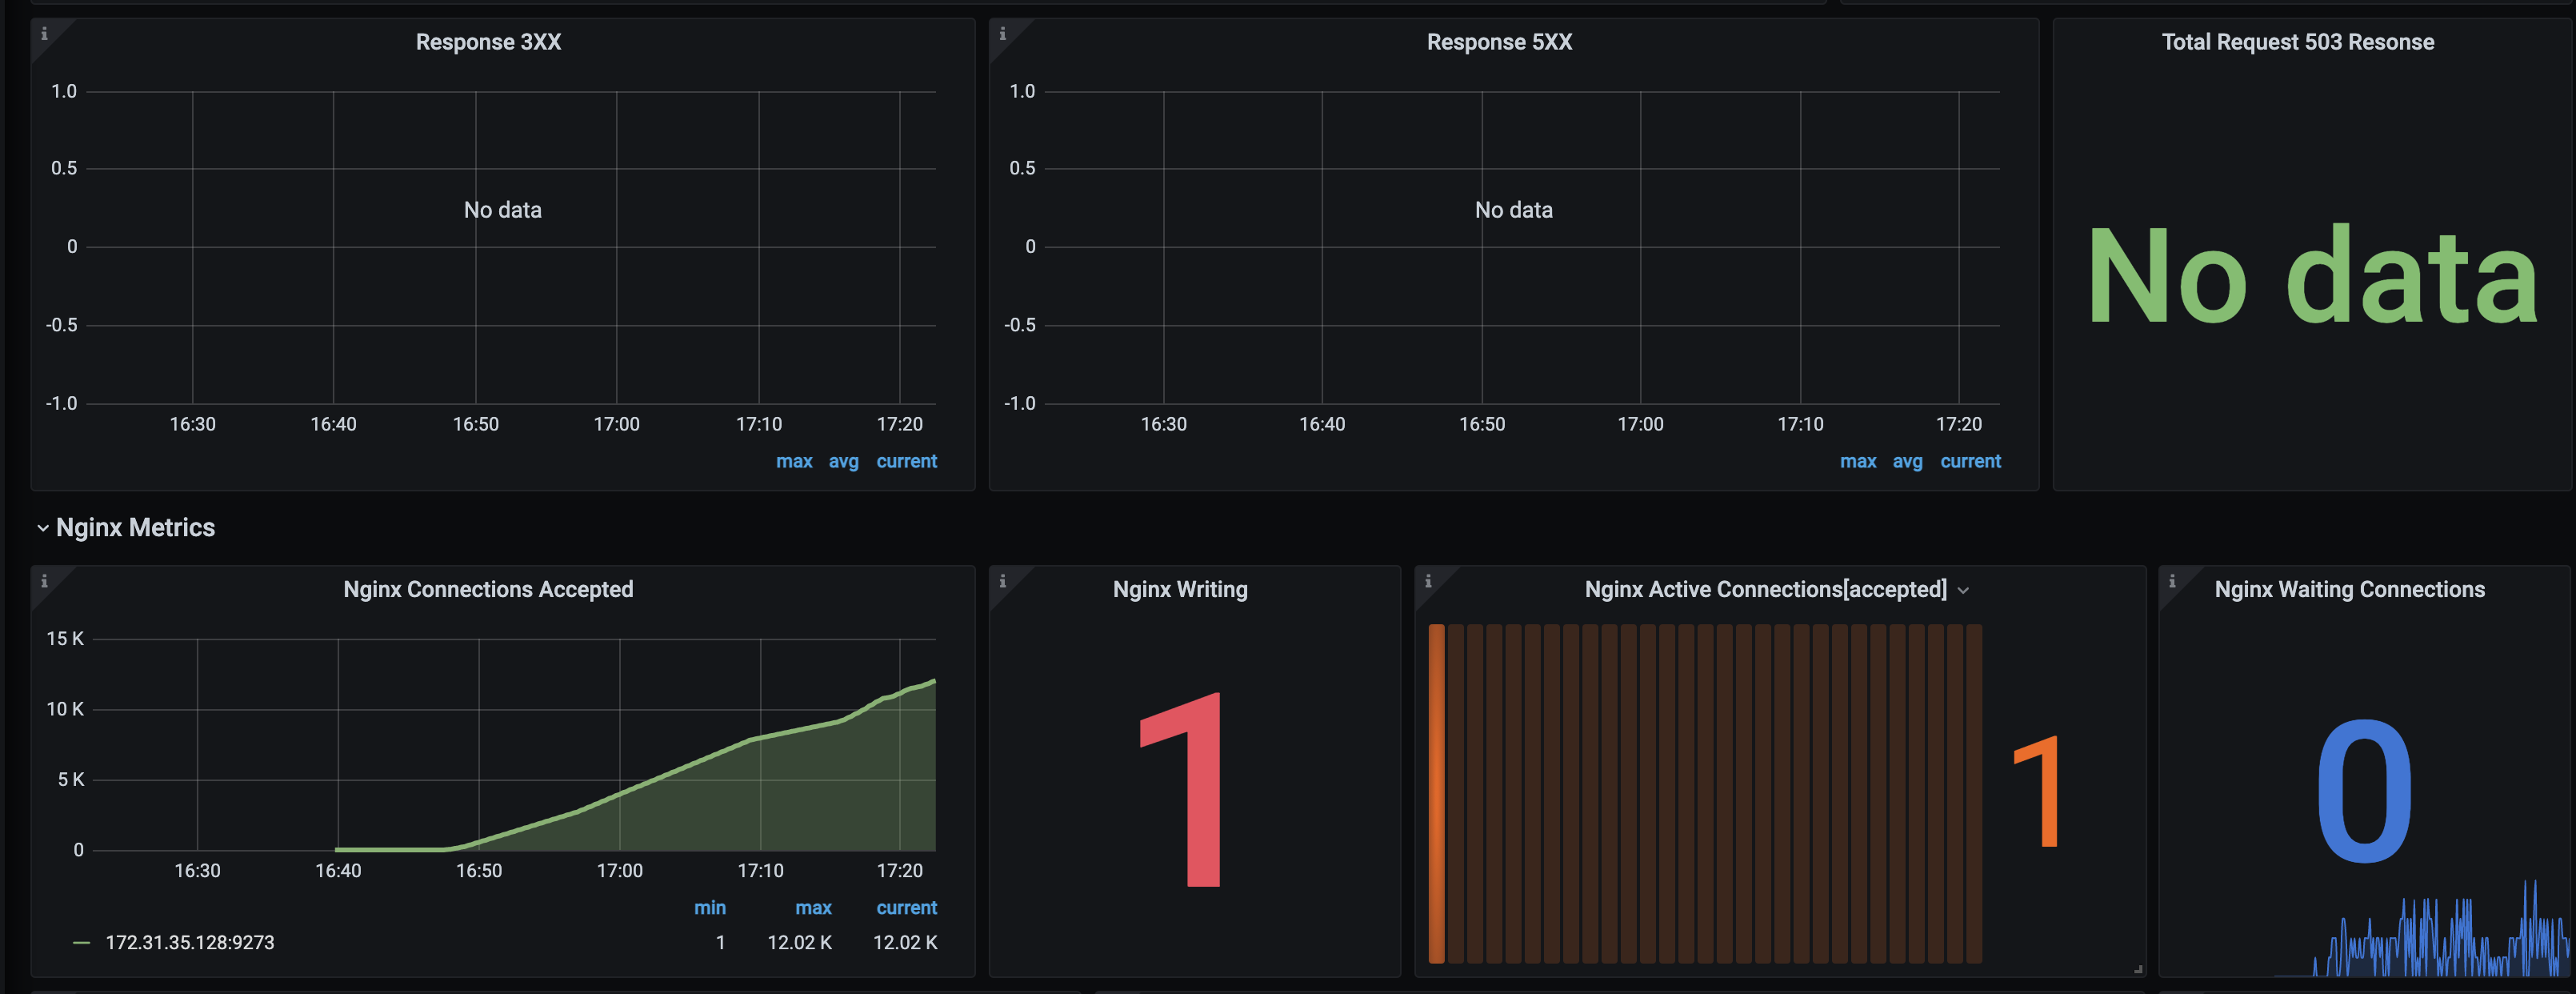
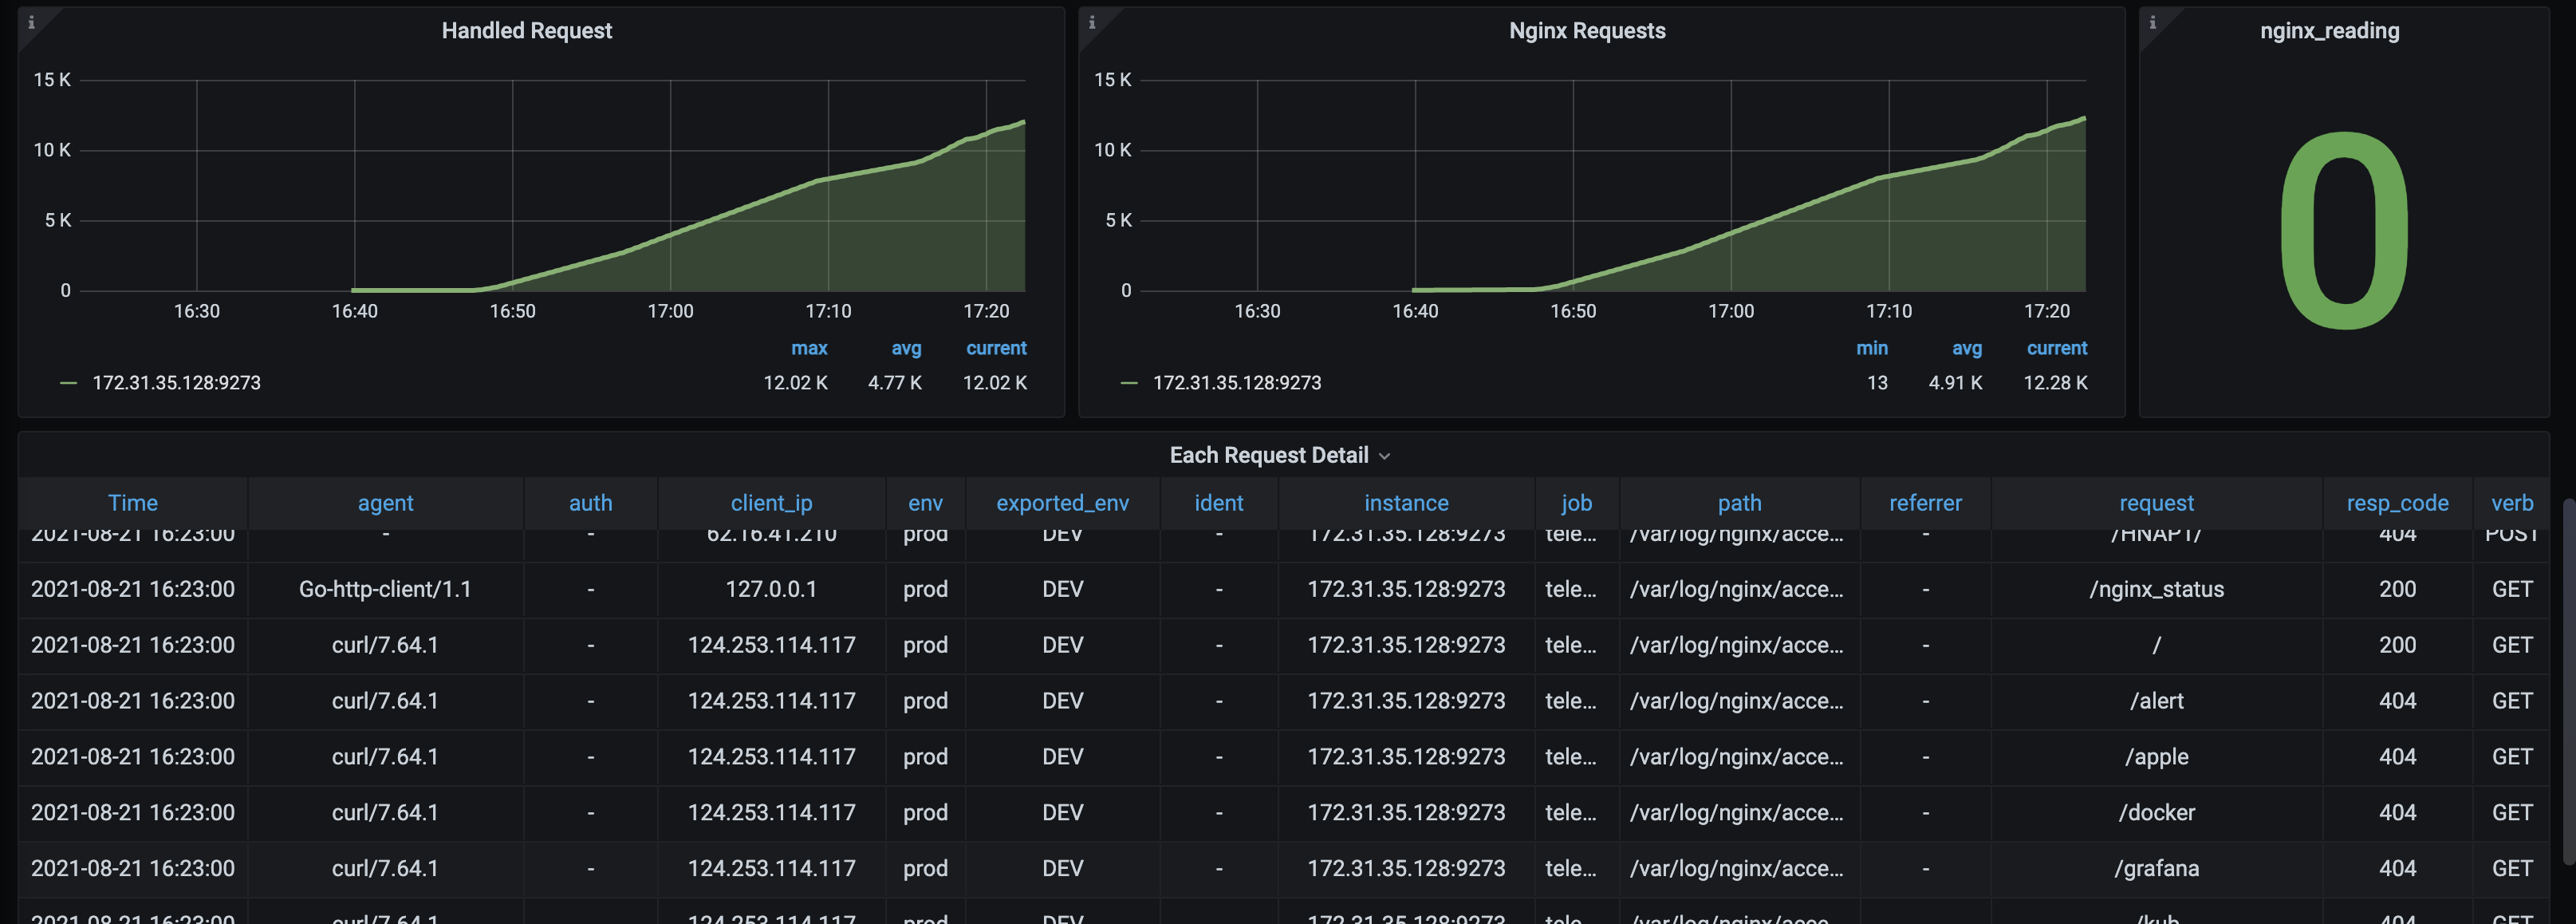
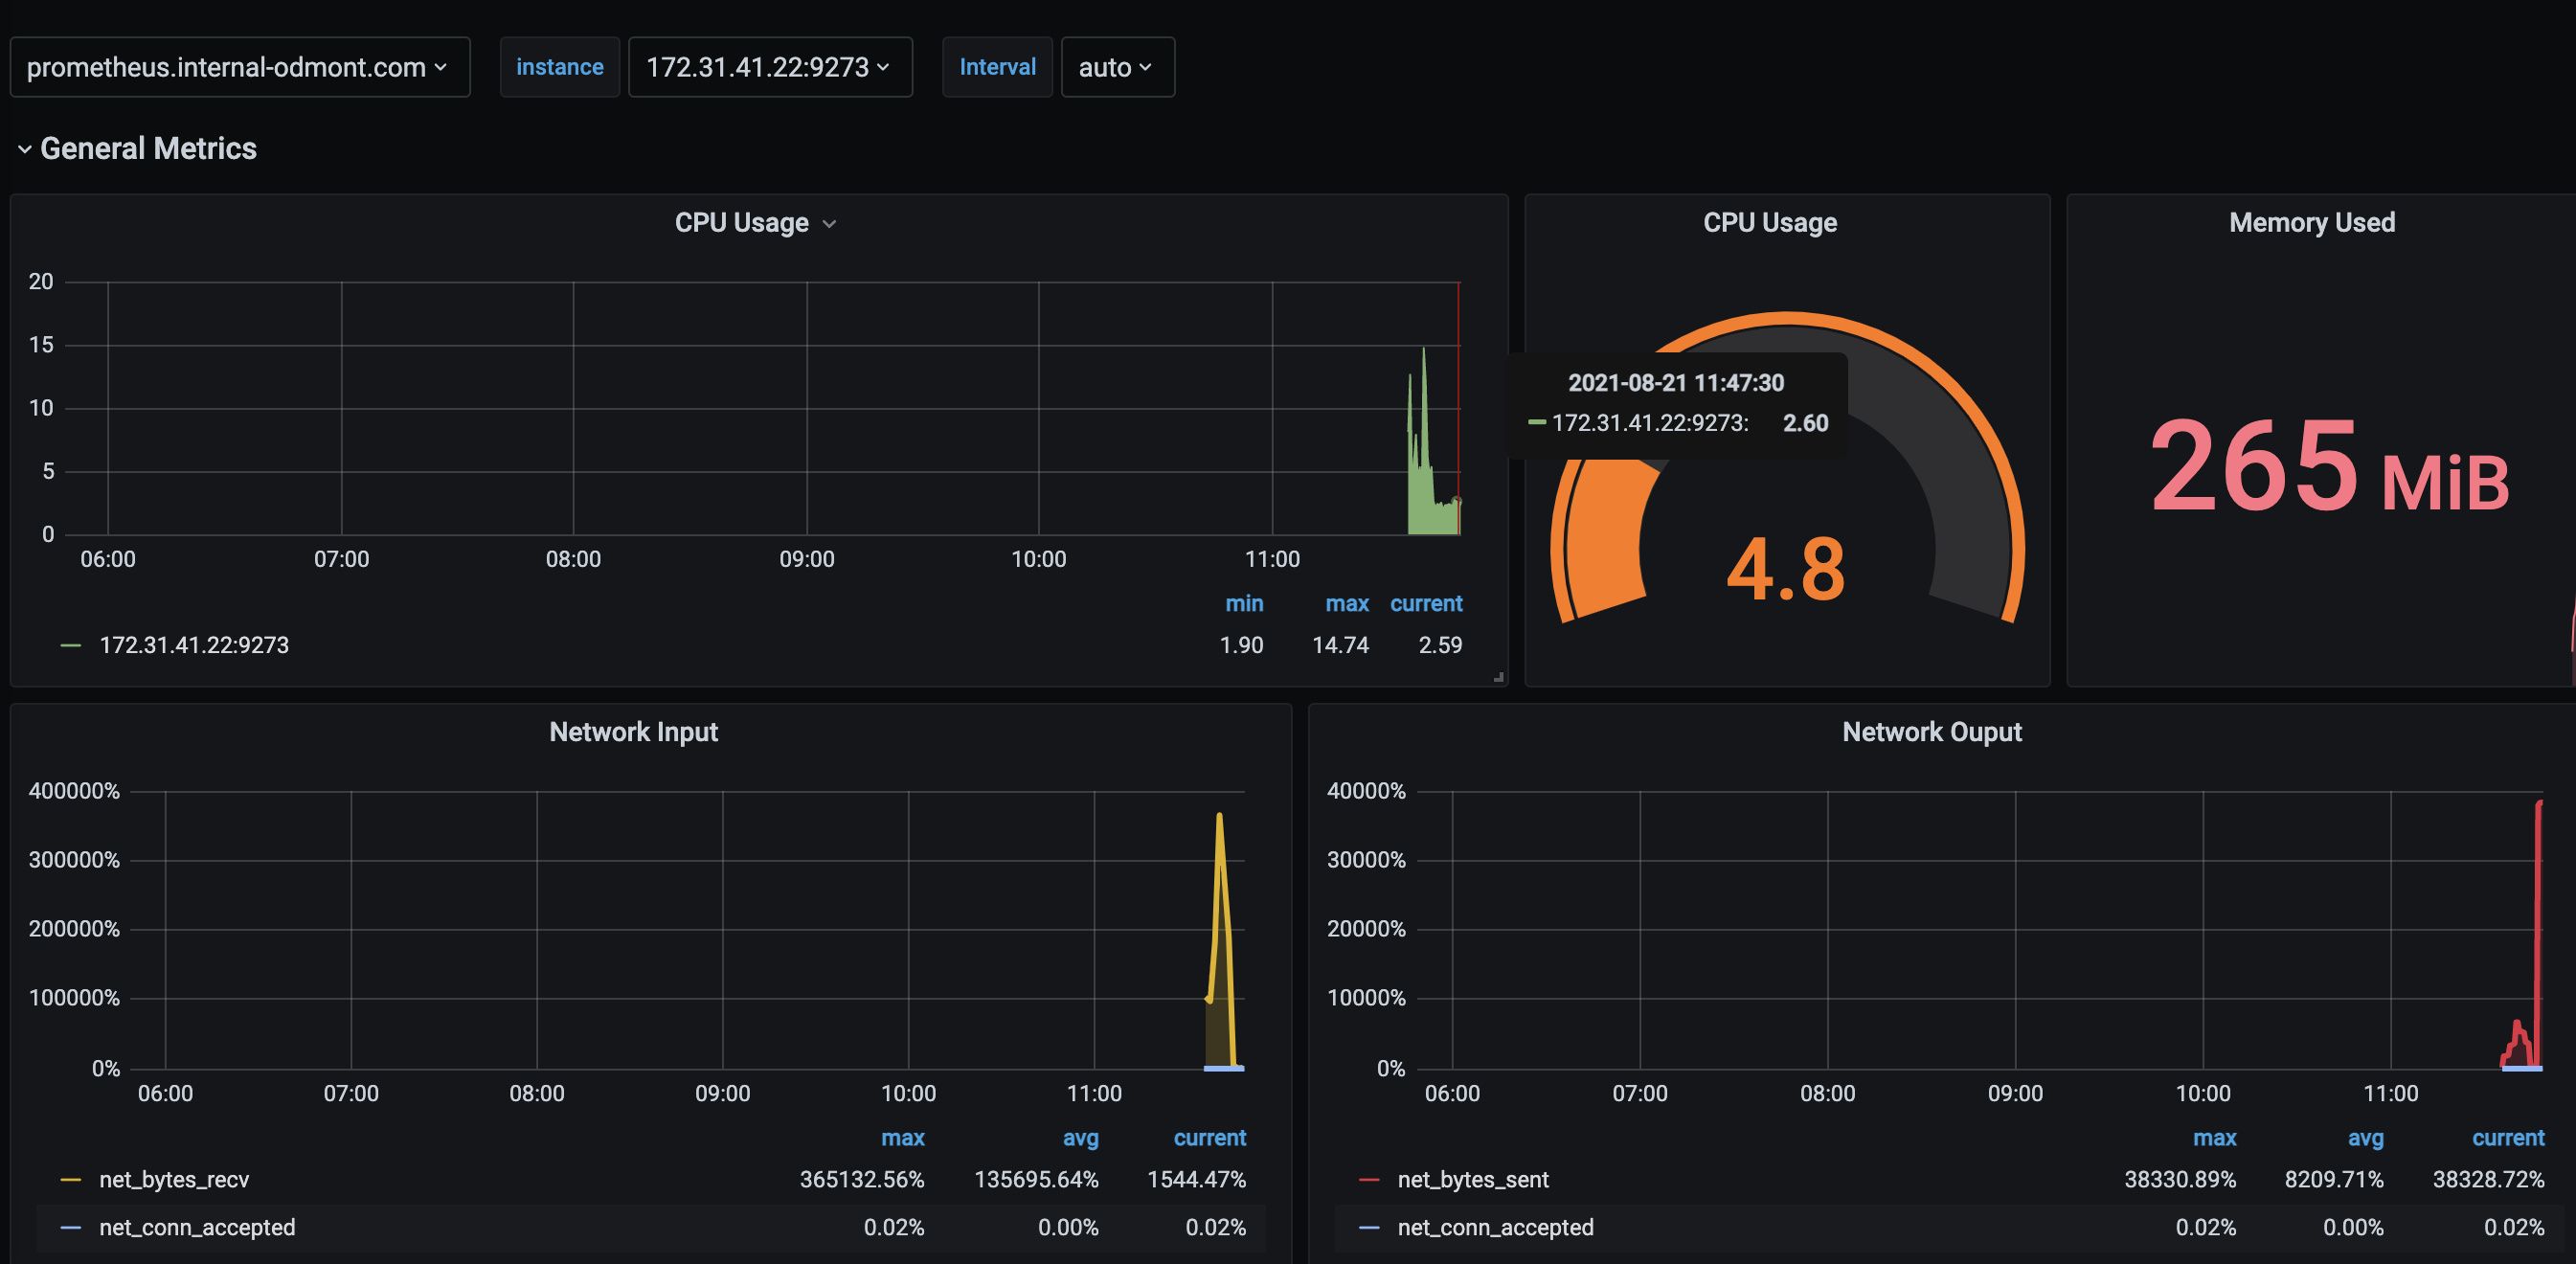
This dashboard monitors Nginx performance and resource usage, combining system metrics with HTTP response and connection data to give a holistic view of server health. It emphasizes key indicators such as cpu_usage_idle, mem_used, and nginx_active (along with traffic metrics like net_bytes_recv and net_bytes_sent) to reveal CPU availability, memory pressure, active connections, and throughput. Key features include per-URL or per-request detail views, time-bounded aggregates for 2XX/4XX/5XX responses, and 24h/5m trend panels to track latency, error rates, and request handling efficiency.
Screenshots
Used Metrics 1313
cpu_usage_idle
mem_used
net_bytes_recv
net_bytes_sent
-
net_conntrack_listener_conn_accepted_total
nginx_accepts
nginx_active
nginx_handled
nginx_reading
nginx_requests
nginx_waiting
nginx_writing
nginxlog_resp_bytes