NGINX 4,5174,517
8/4/2020
10/10/2020
2
>=6.7.4
Prometheus
Description
Official dashboard for NGINX Prometheus exporter (Nothing Different, Just Primp!)
Screenshots
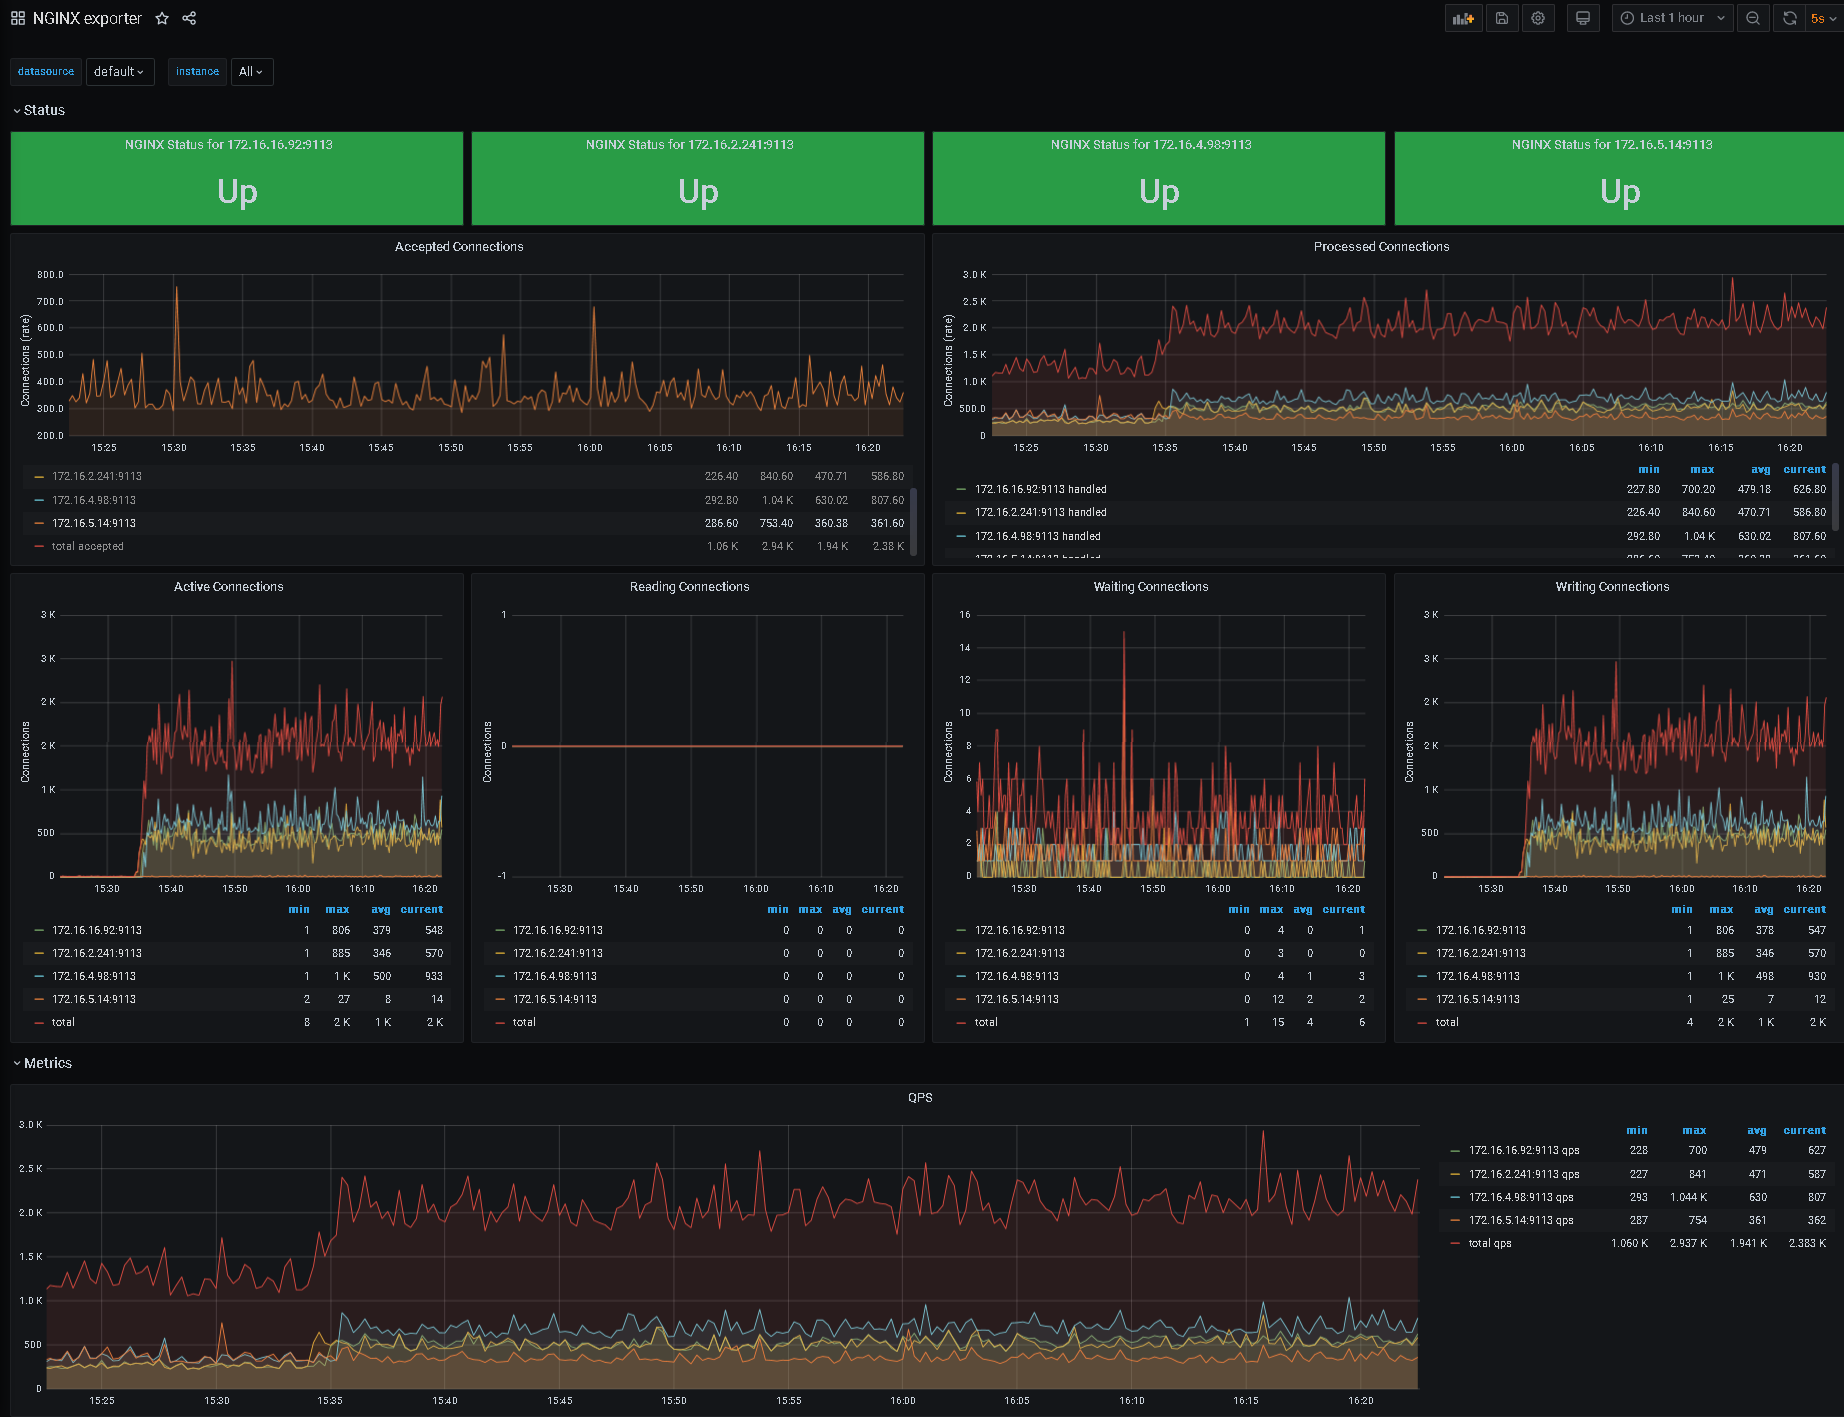
Used Metrics 88
nginx_connections_accepted
nginx_connections_active
nginx_connections_handled
nginx_connections_reading
nginx_connections_waiting
nginx_connections_writing
nginx_http_requests_total
nginx_up
Get Dashboard✕
Download
Copy to Clipboard