Nextcloud 4,1974,197
3/17/2024
10/12/2025
2
Web Servers
>=10.4.1
Prometheus
Description
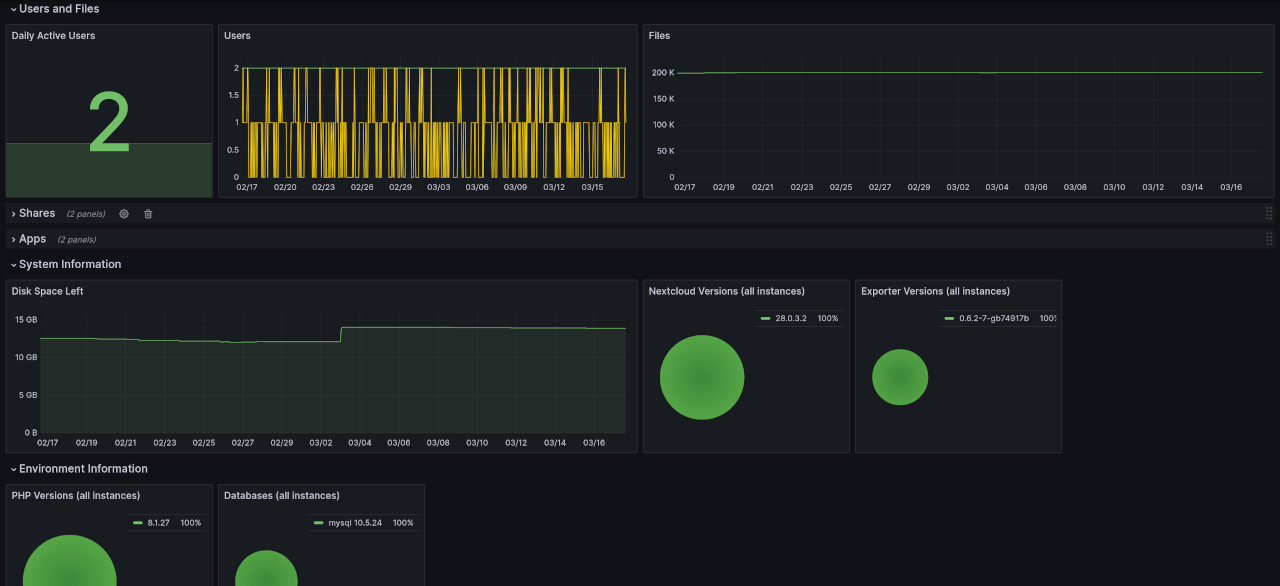
Screenshots
Used Metrics 1414
nextcloud_active_users_daily_total
nextcloud_active_users_total
nextcloud_apps_installed_total
nextcloud_apps_updates_available_total
nextcloud_database_info
nextcloud_exporter_info
nextcloud_files_total
nextcloud_free_space_bytes
nextcloud_php_info
nextcloud_scrape_errors_total
nextcloud_shares_federated_total
nextcloud_shares_total
nextcloud_system_info
nextcloud_users_total
Get Dashboard✕
Download
Copy to Clipboard