Network Traffic Flow Analysis 2,0162,016
11/17/2019
11/17/2019
1
Host Metrics
>=6.4.3
Prometheus
Description
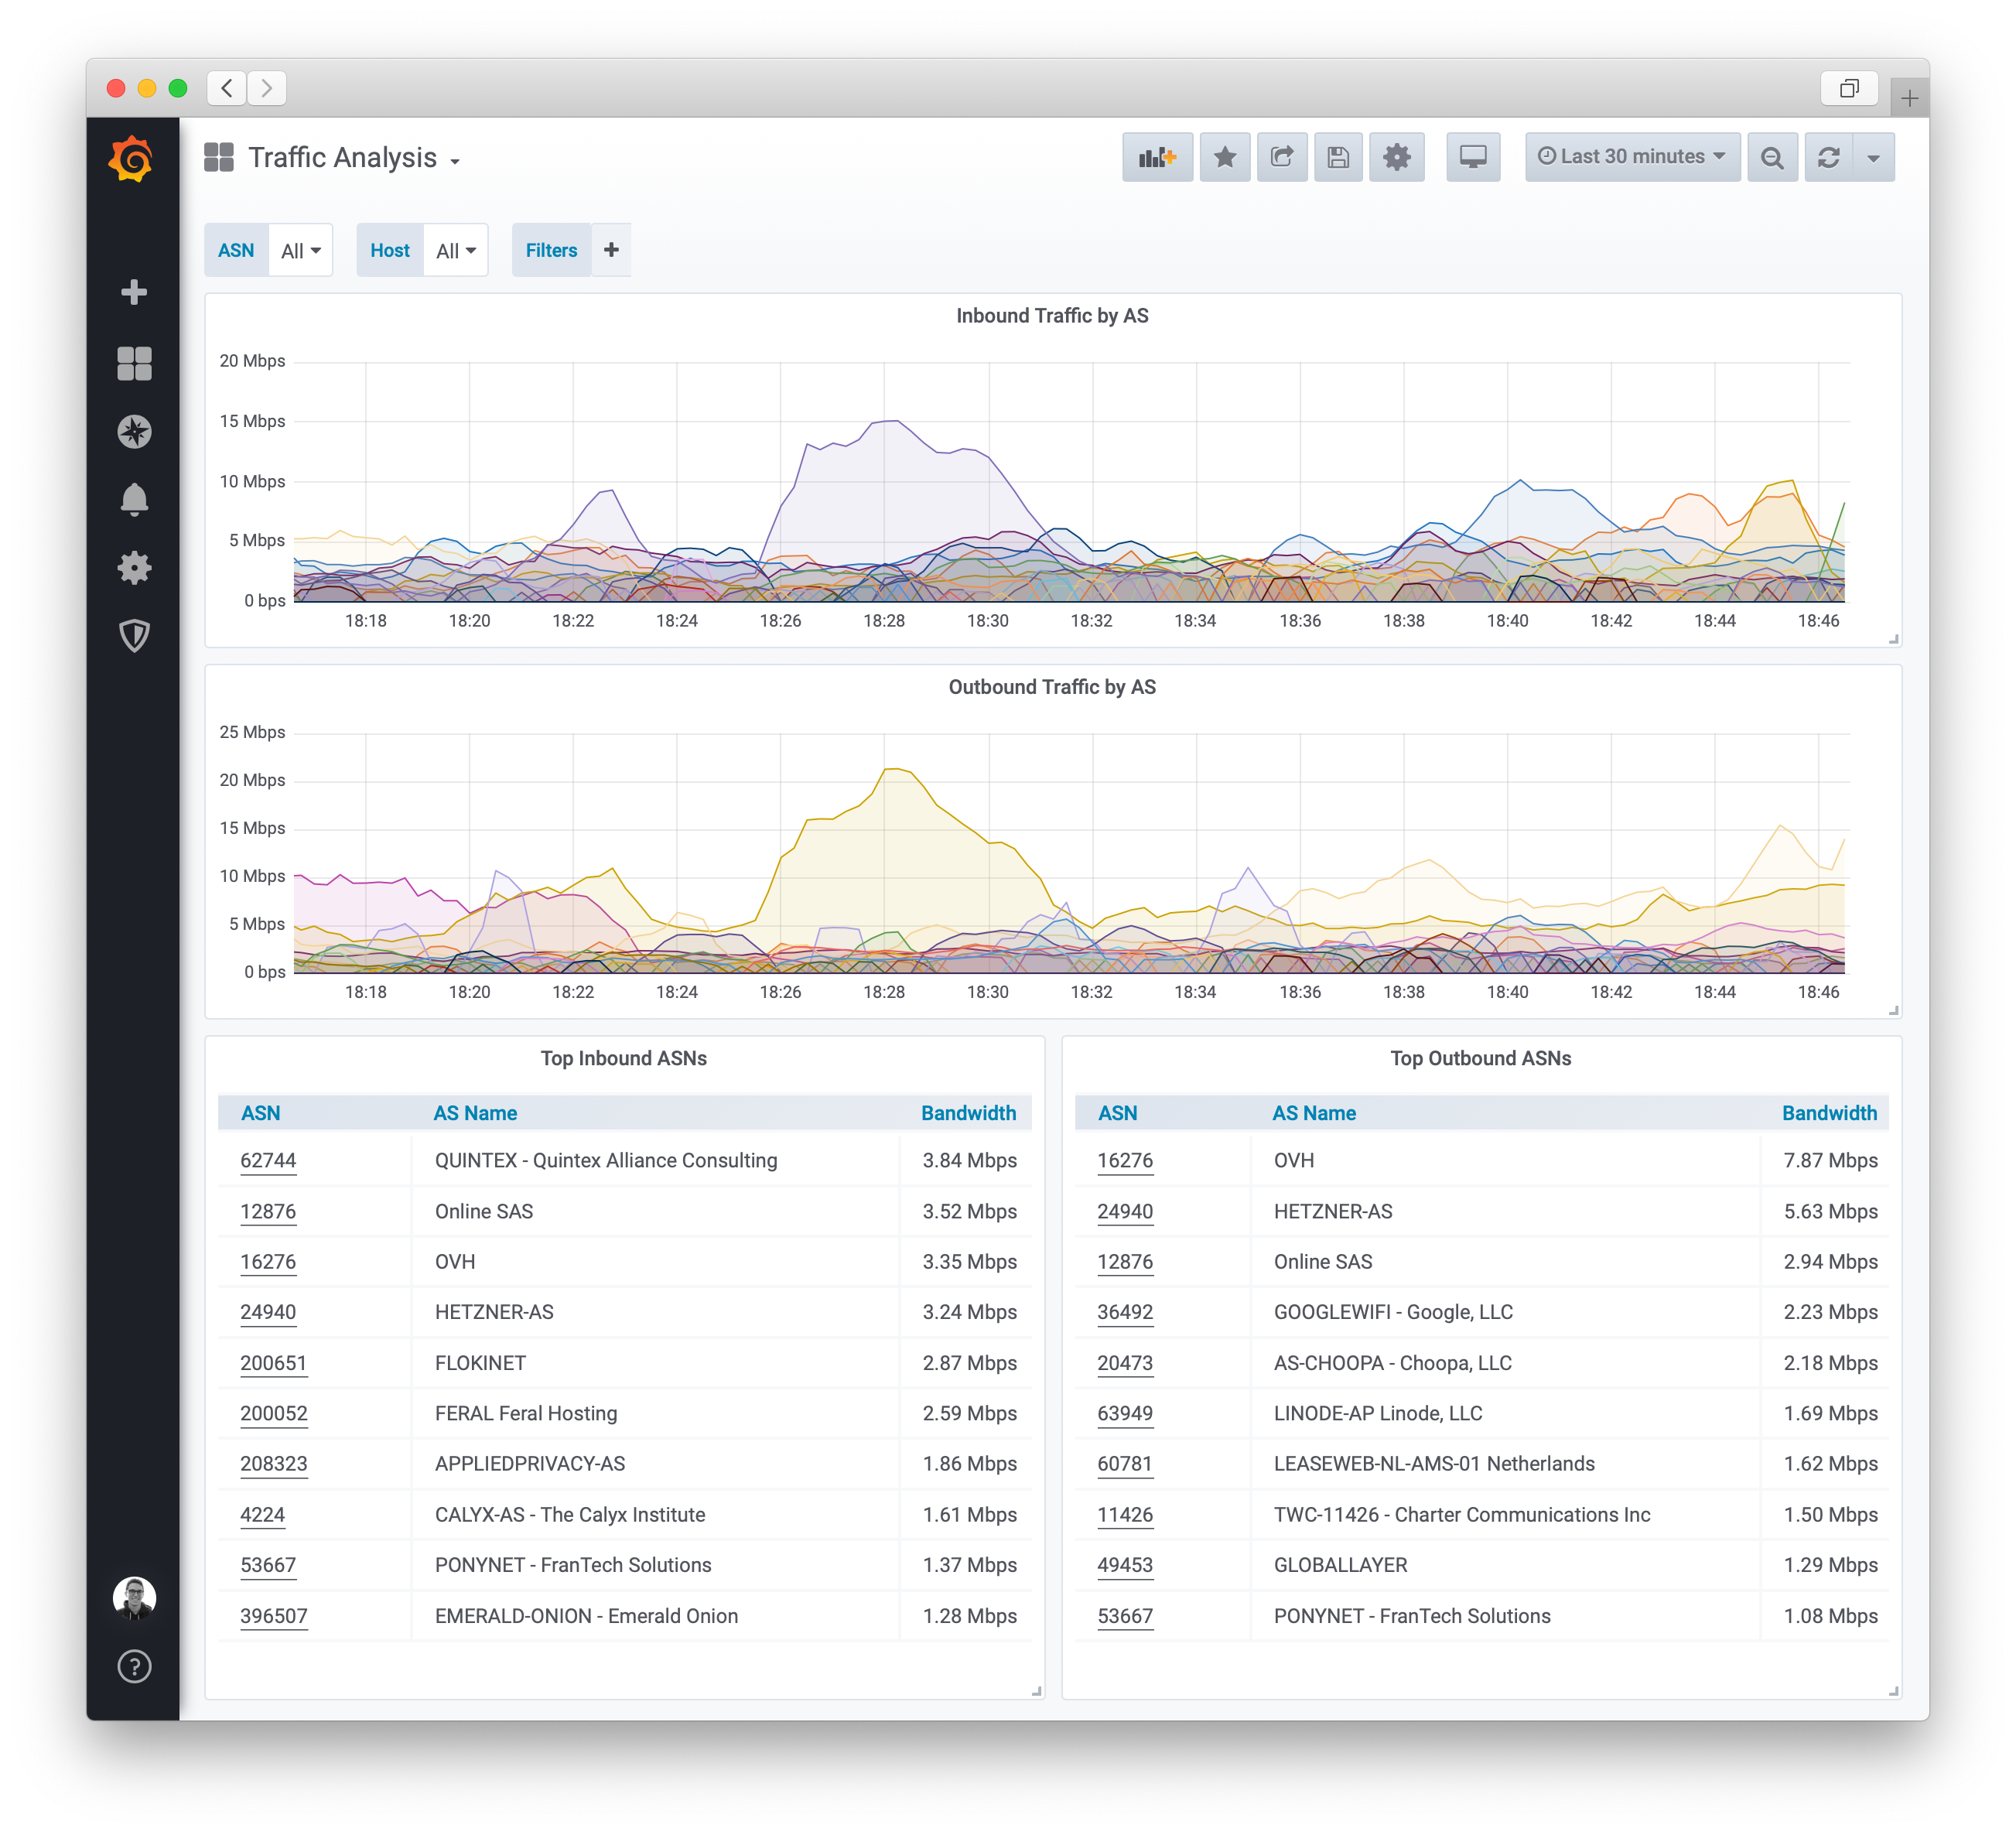
A dashboard to display the various autonomous systems a router is communicating with.
Screenshots
Used Metrics 33
flow_receive_bytes_total
flow_transmit_bytes_total
topk
Get Dashboard✕
Download
Copy to Clipboard