Prom
hub
Alerts
Dashboards
Exporters
Metrics
Alerts
Dashboards
Exporters
Metrics
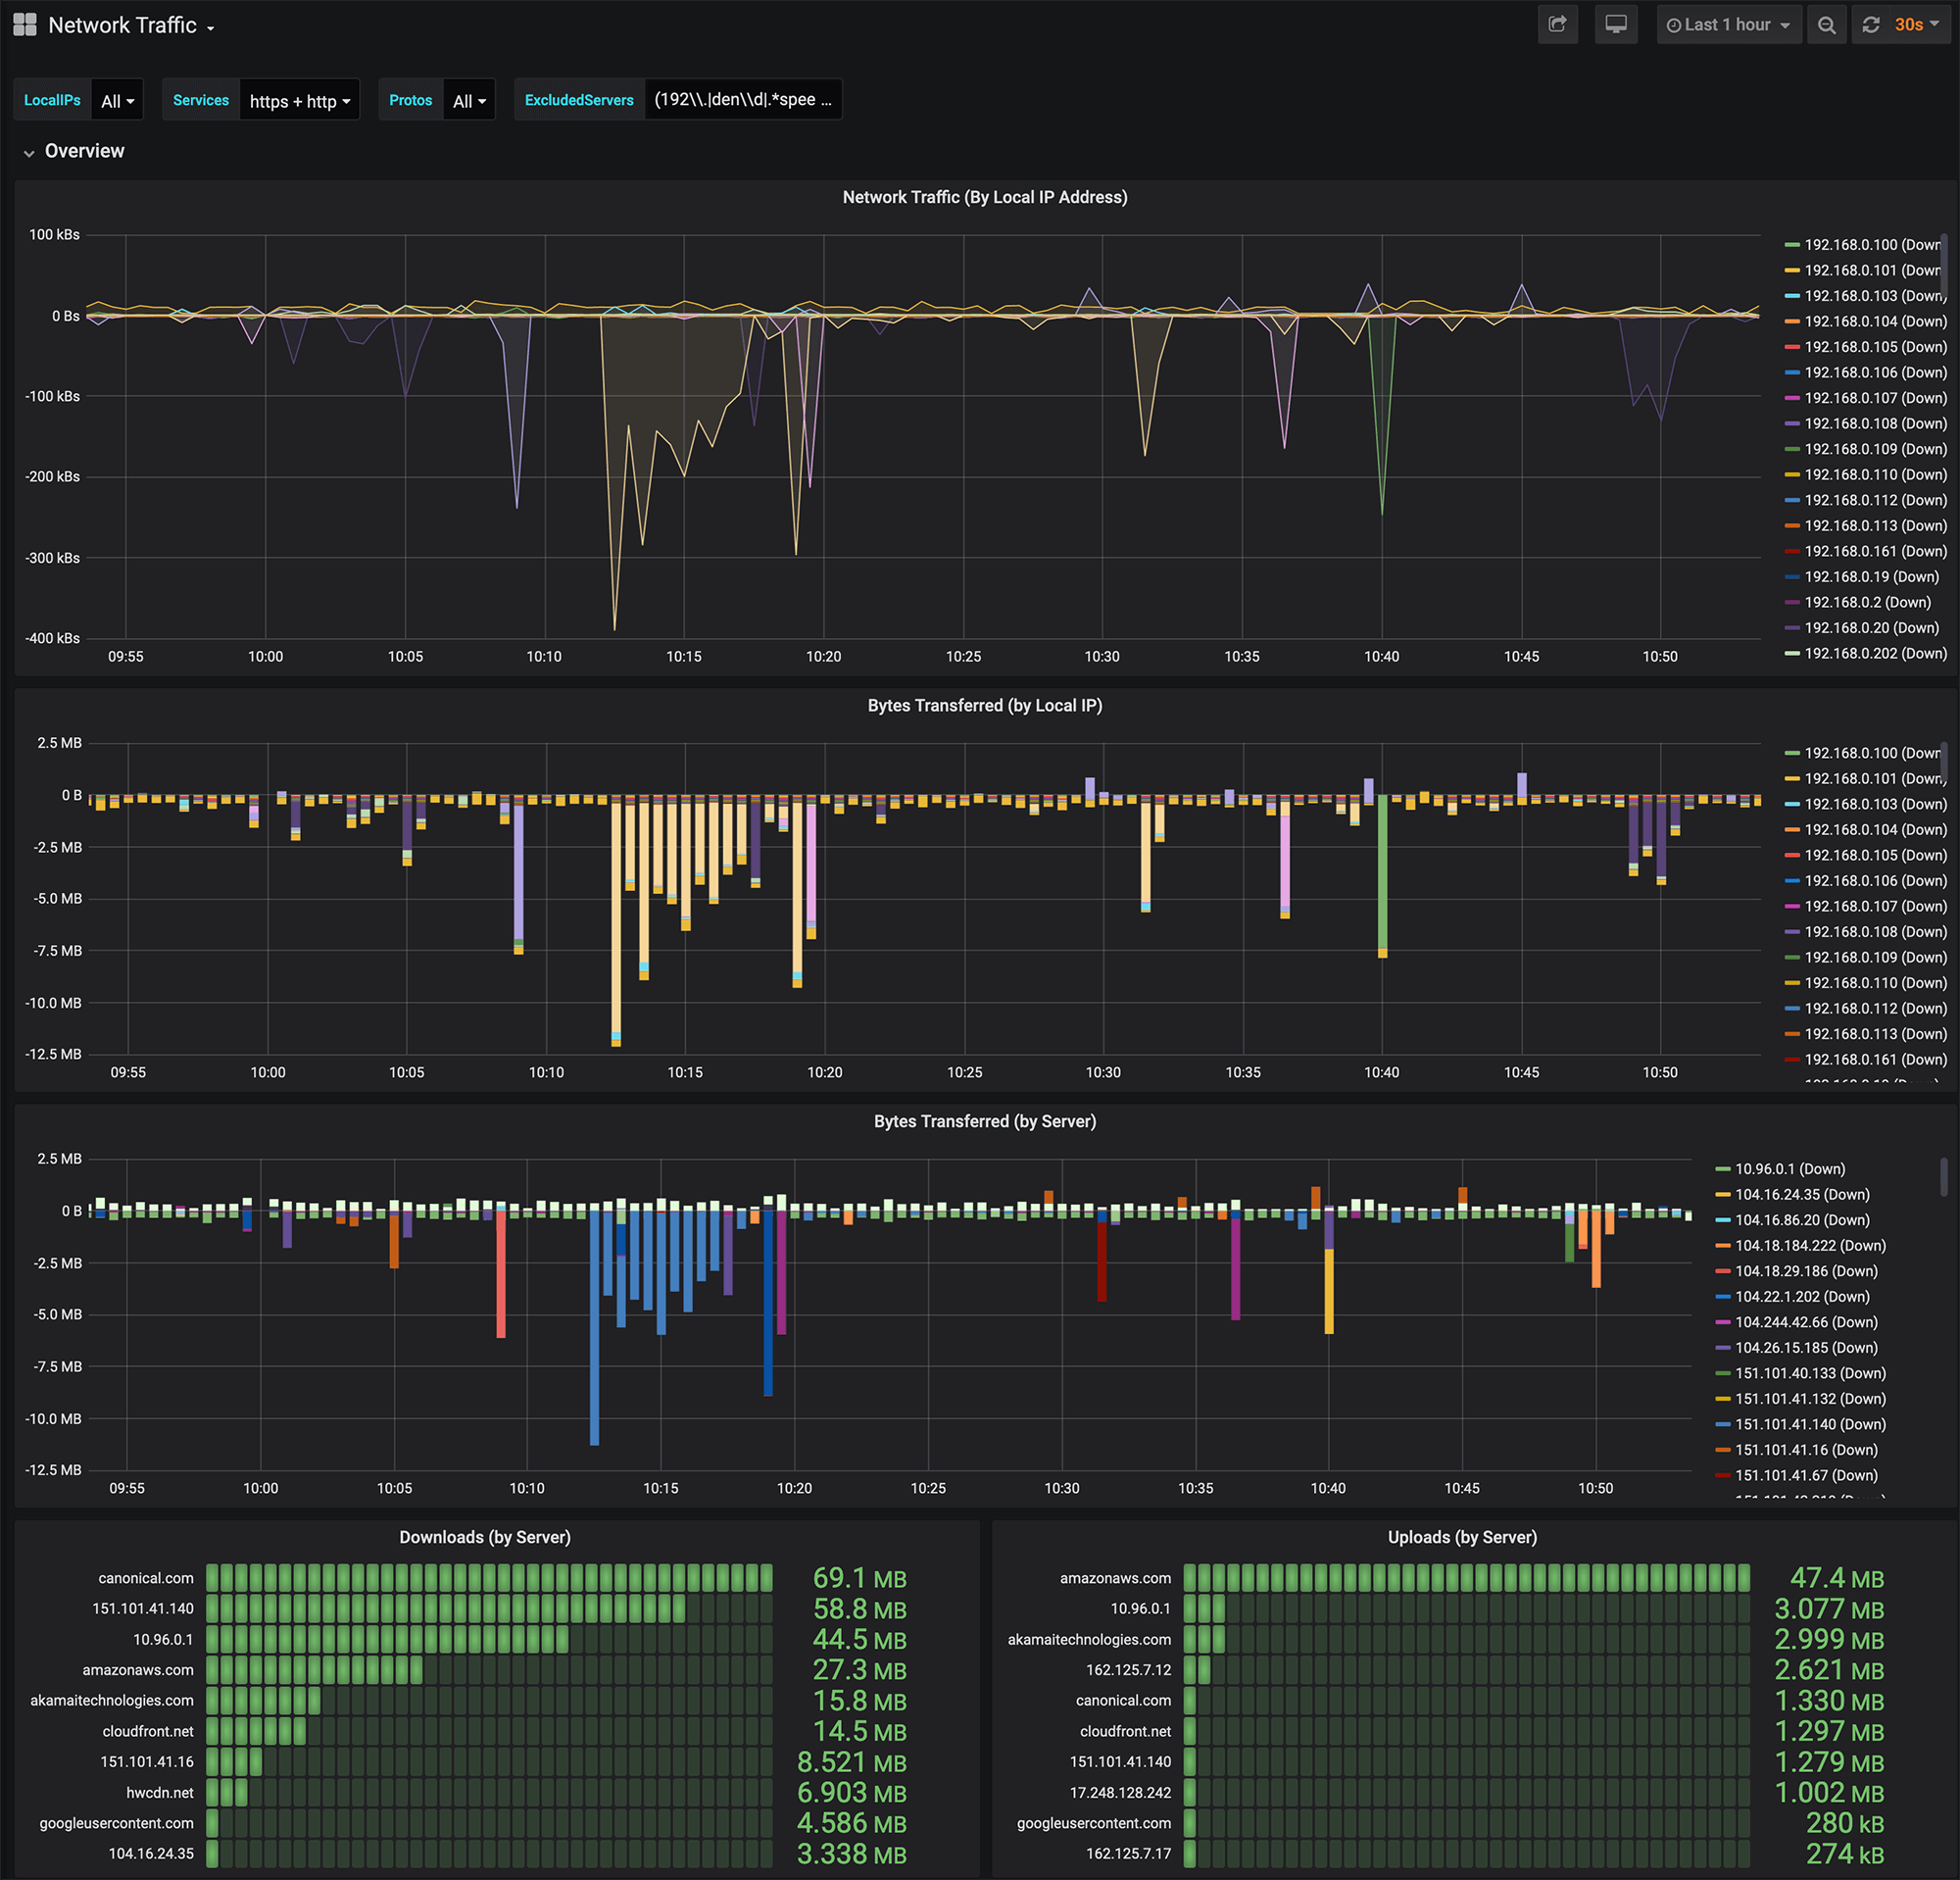
Network Traffic
4
,
2
4
6
4,246
Show Preview
Get Dashboard
Download
Copy to Clipboard
Created
7/9/2020
Updated
9/30/2020
Revision
2
Categories
Docker
Host Metrics
Grafana Version
>=6.6.2
Datasources
Prometheus
Description
Screenshots
Source
Grafana.com
Used Metrics
2
2
ntm_bytes_total
topk
Get Dashboard
✕
Download
Copy to Clipboard
✕
Dashboard Preview - Network Traffic
Most Grafana dashboards are not optimized for small screens. For the best experience, view this preview on a larger screen.
grafana.shipit.dev/network-traffic
close