Network Monitoring 1,5861,586 3.0 (1 reviews)
1/14/2020
1/14/2020
1
Docker
>=6.2.5
Prometheus
Description
The dashboard accompanying https://github.com/deviavir/k8s-quin
Screenshots
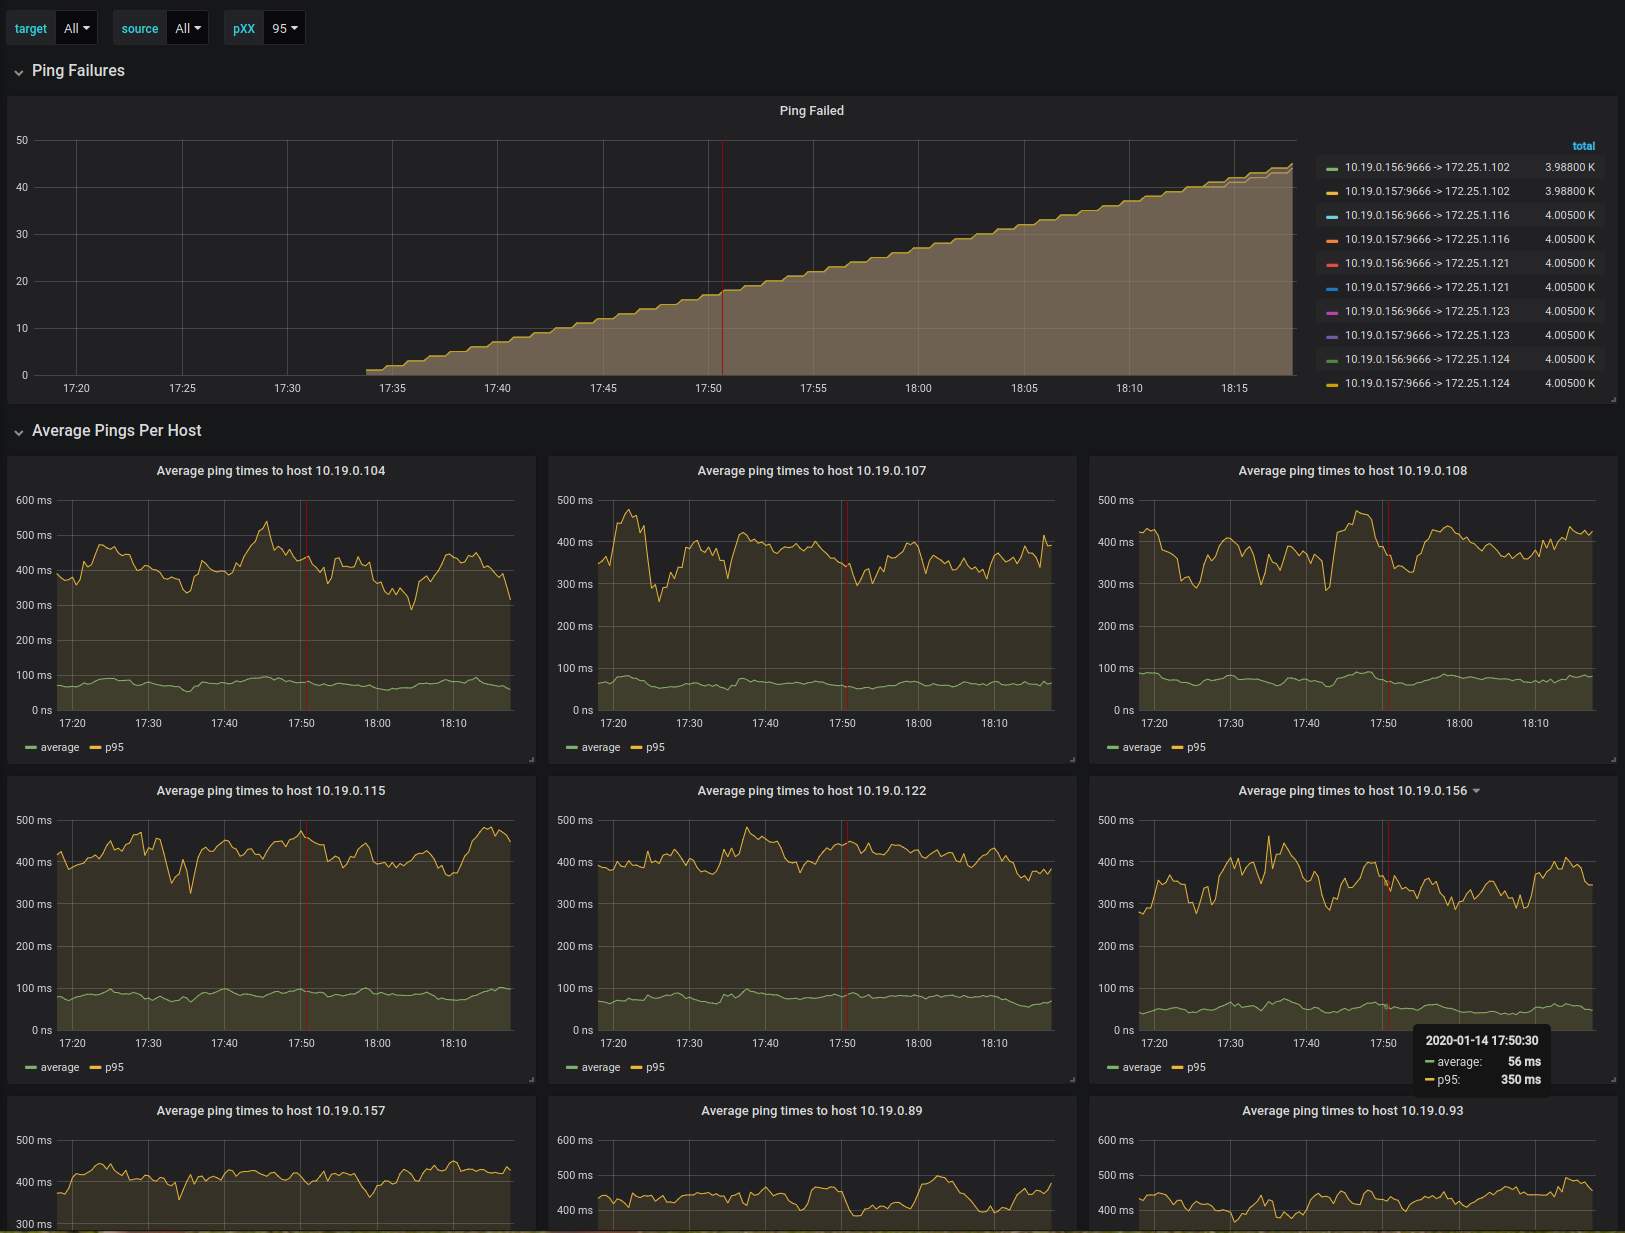
Used Metrics 55
pXX
ping_failed_count
ping_seconds_bucket
ping_seconds_count
ping_seconds_sum
Get Dashboard✕
Download
Copy to Clipboard