Network Latency and Bandwidth 1,0601,060
7/11/2021
7/11/2021
1
>=8.0.4
Prometheus
Description
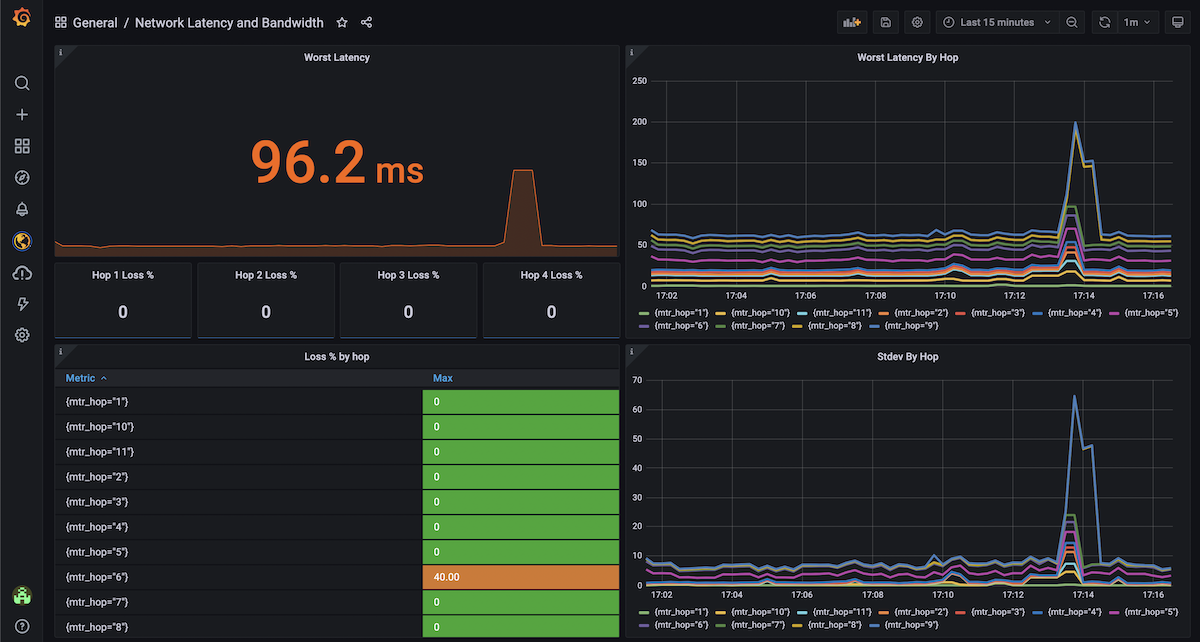
Latency statistics from MTR, Bandwith from Speedtest.net
Screenshots
Used Metrics 55
mtr_lossperc
mtr_stdev
mtr_wrst
speedtest_download
speedtest_upload
Get Dashboard✕
Download
Copy to Clipboard