Netty-echo-server-Metrics 827827 4.0 (1 reviews)
3/8/2018
3/15/2018
3
Web Servers
>=5.0.0
Prometheus
Description
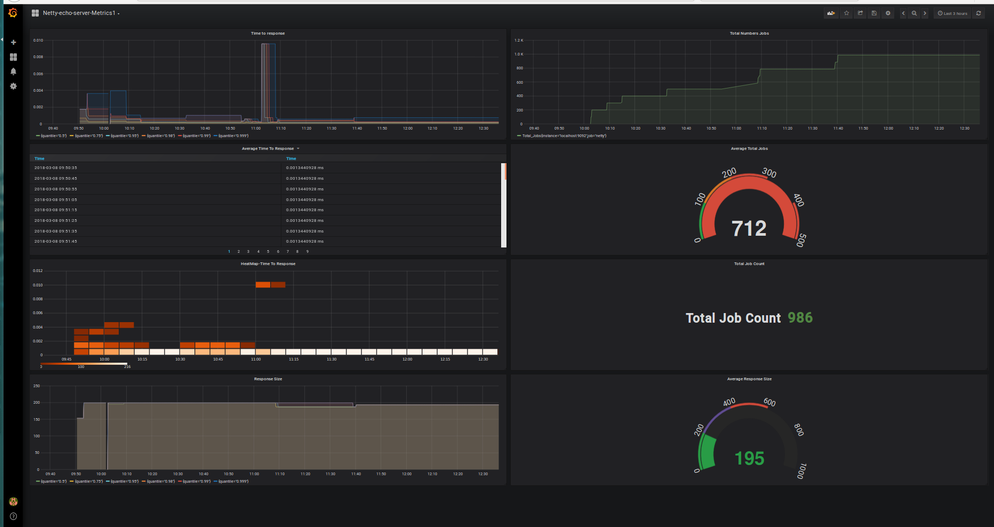
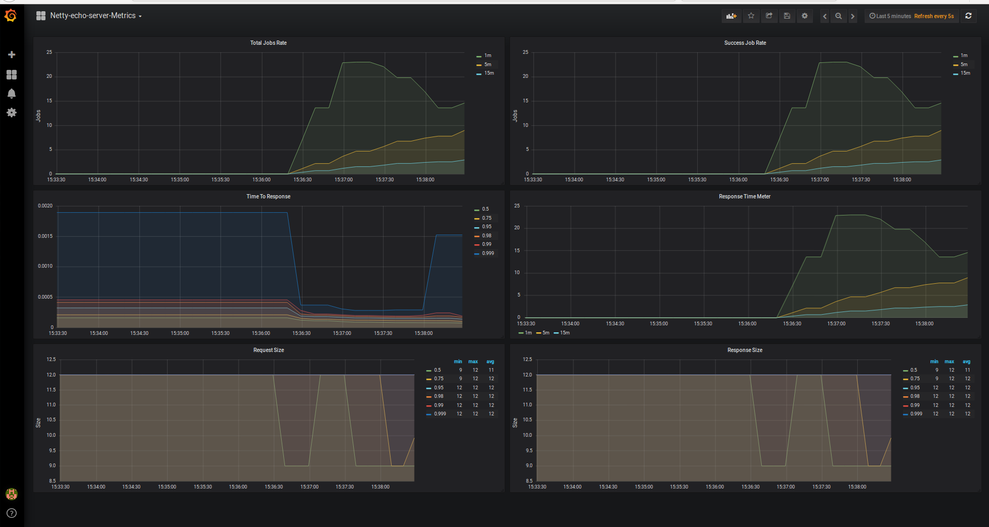
Sample Dashboard for Netty-echo-server
Screenshots
Used Metrics 55
Request_Size
Success_Jobs
Time_To_Response
Time_To_Response_count
Total_Jobs
Get Dashboard✕
Download
Copy to Clipboard