Netdata and prometheus 1,0611,061 5.0 (2 reviews)
5/12/2020
5/12/2020
1
>=6.7.3
Prometheus
Description
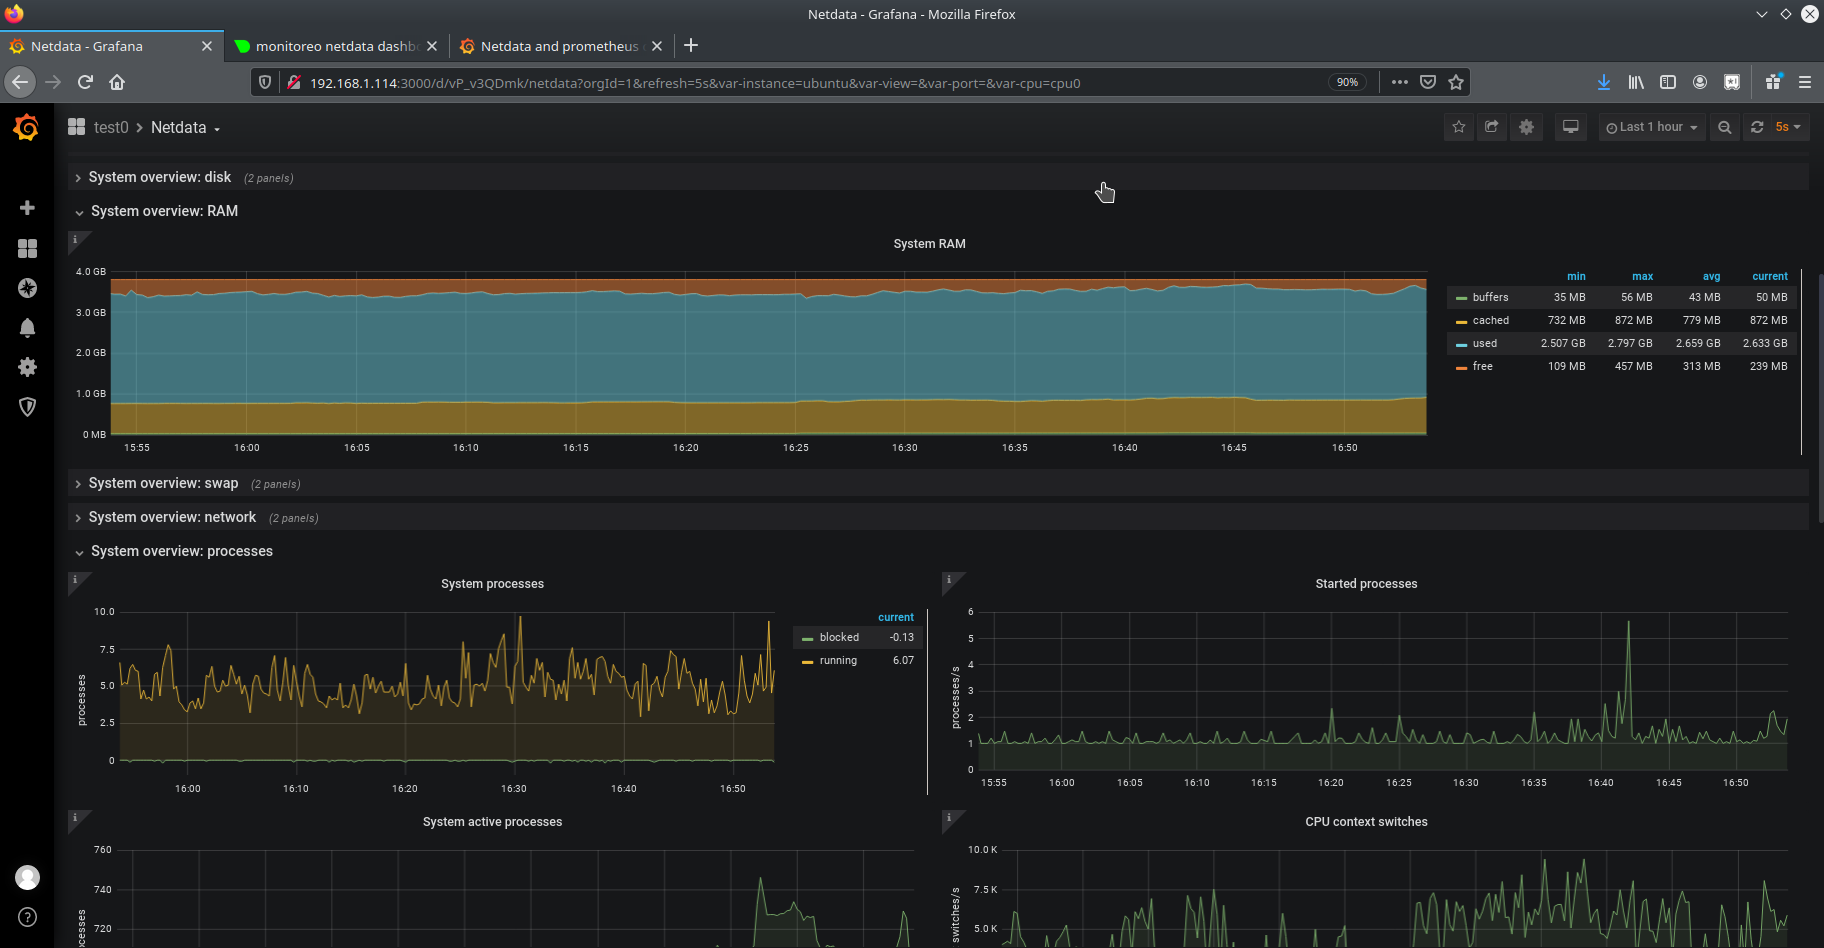
Updated Netdata dashboards for Grafana via Prometheus.
Screenshots
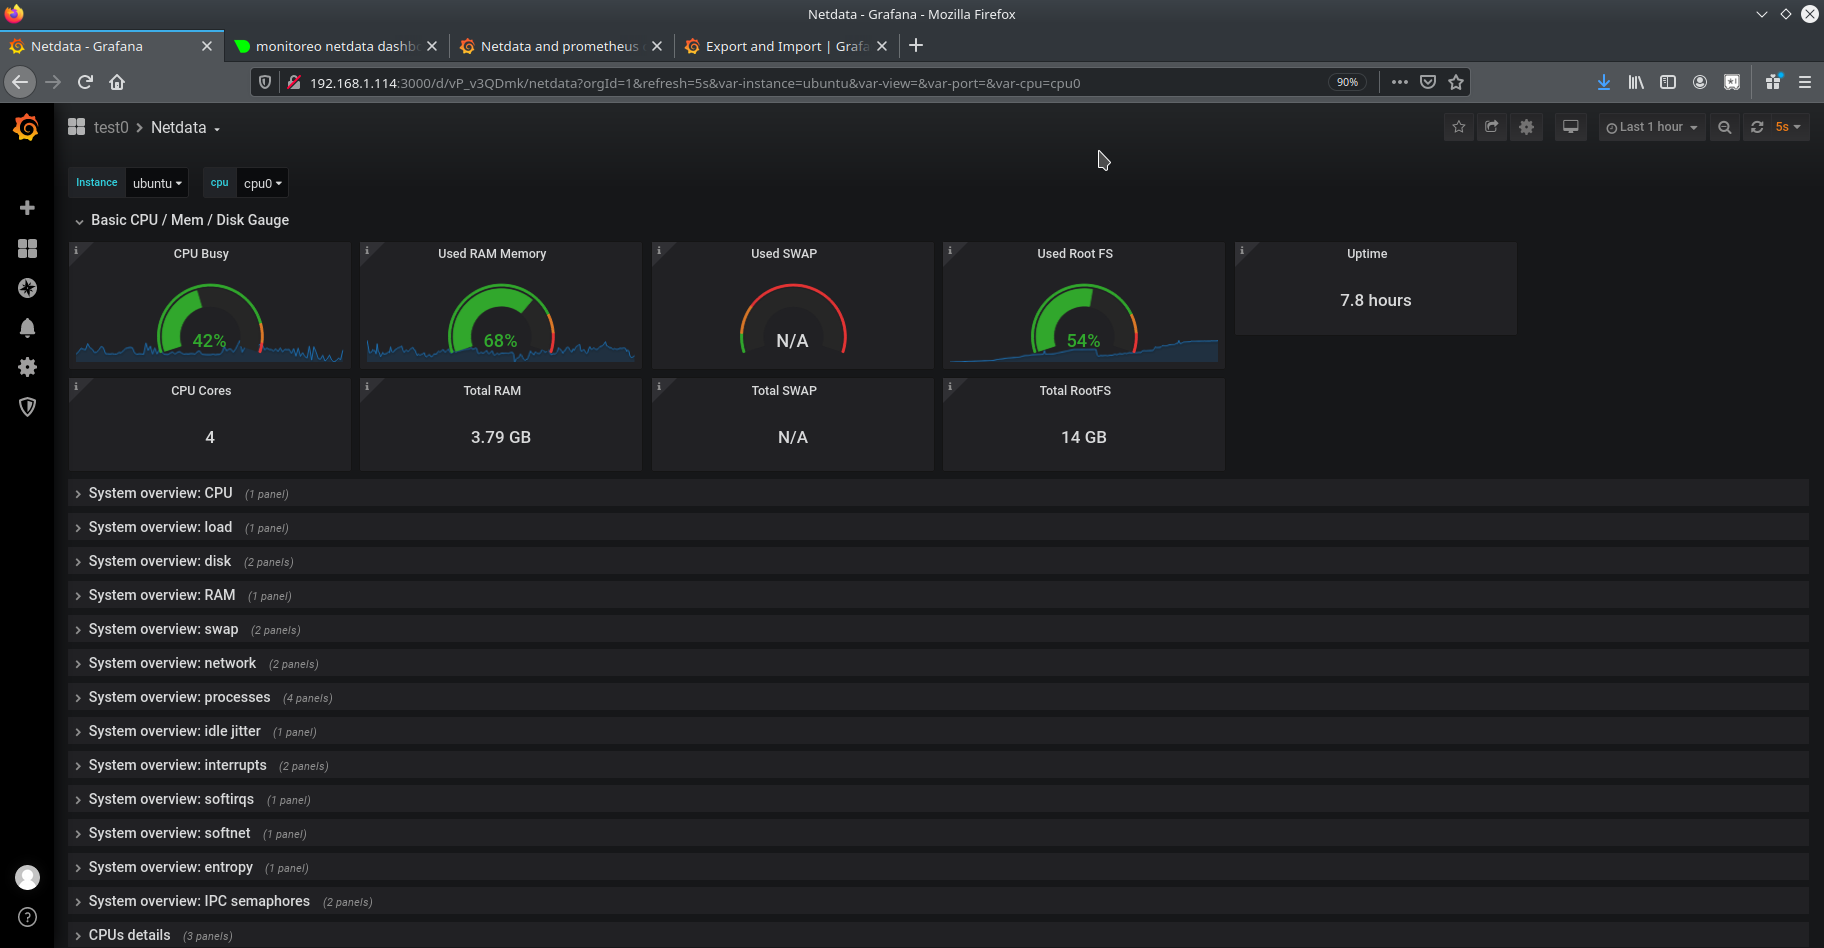
Used Metrics 66
netdata_cpu_cpu_percentage_average
netdata_disk_space_GiB_average
netdata_system_cpu_percentage_average
netdata_system_ram_MiB_average
netdata_system_swap_MiB_average
netdata_system_uptime_seconds_average
Get Dashboard✕
Download
Copy to Clipboard