NATS Server Dashboard 13,55713,557
5/16/2017
5/17/2017
1
>=3.1.1
Prometheus
Description
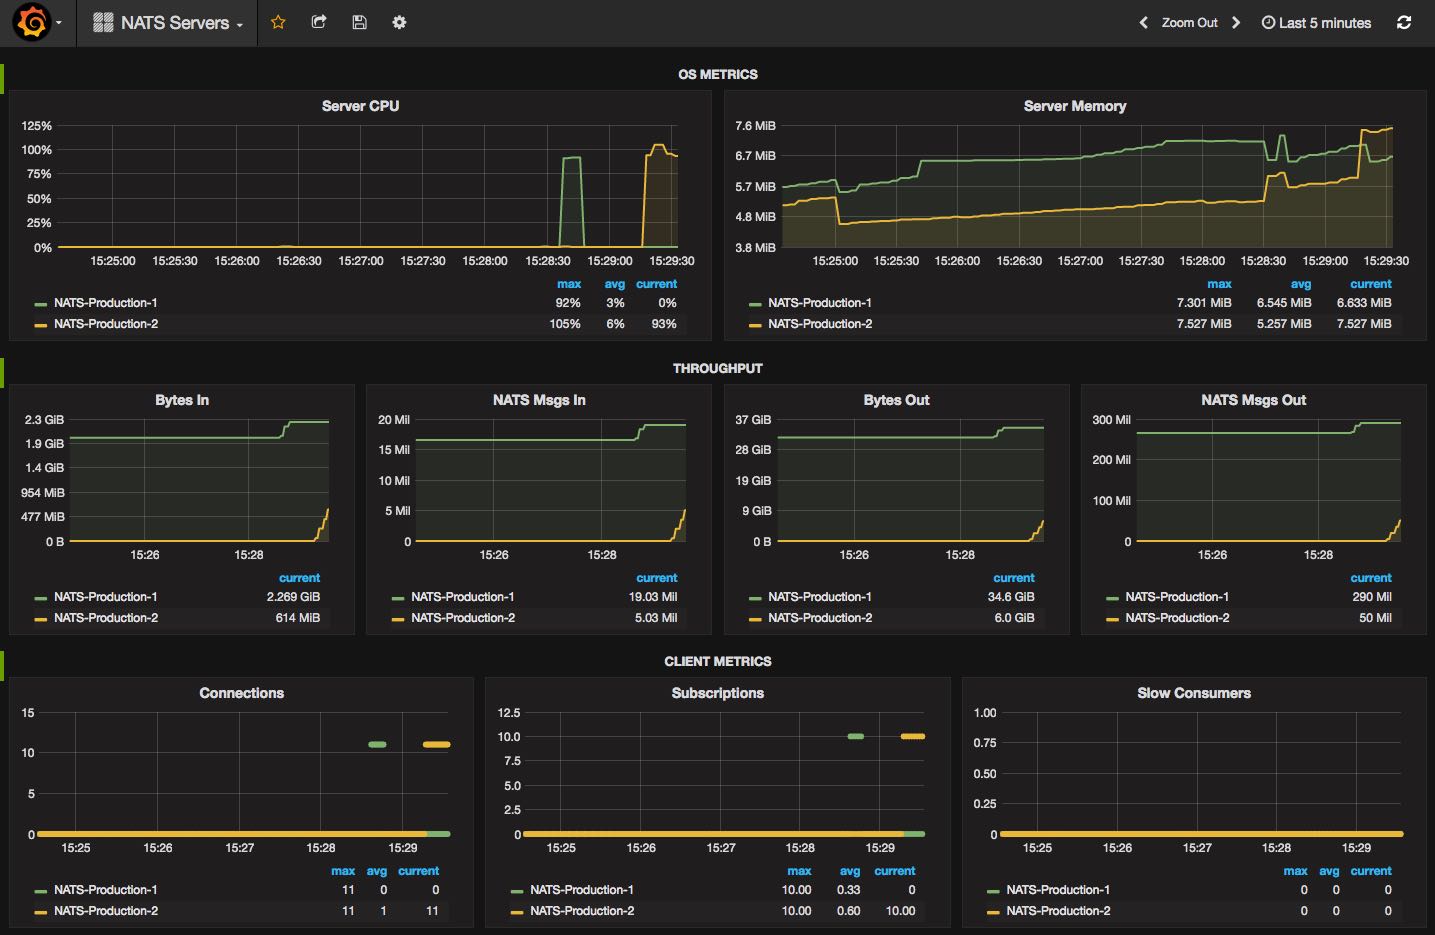
NATS Server Dashboard for use with the Prometheus NATS Exporter
Screenshots
Get Dashboard✕
Download
Copy to Clipboard
NATS Server Dashboard for use with the Prometheus NATS Exporter