NATS JetStream 4,3574,357
7/16/2021
2/9/2022
2
>=8.3.4
Prometheus
Description
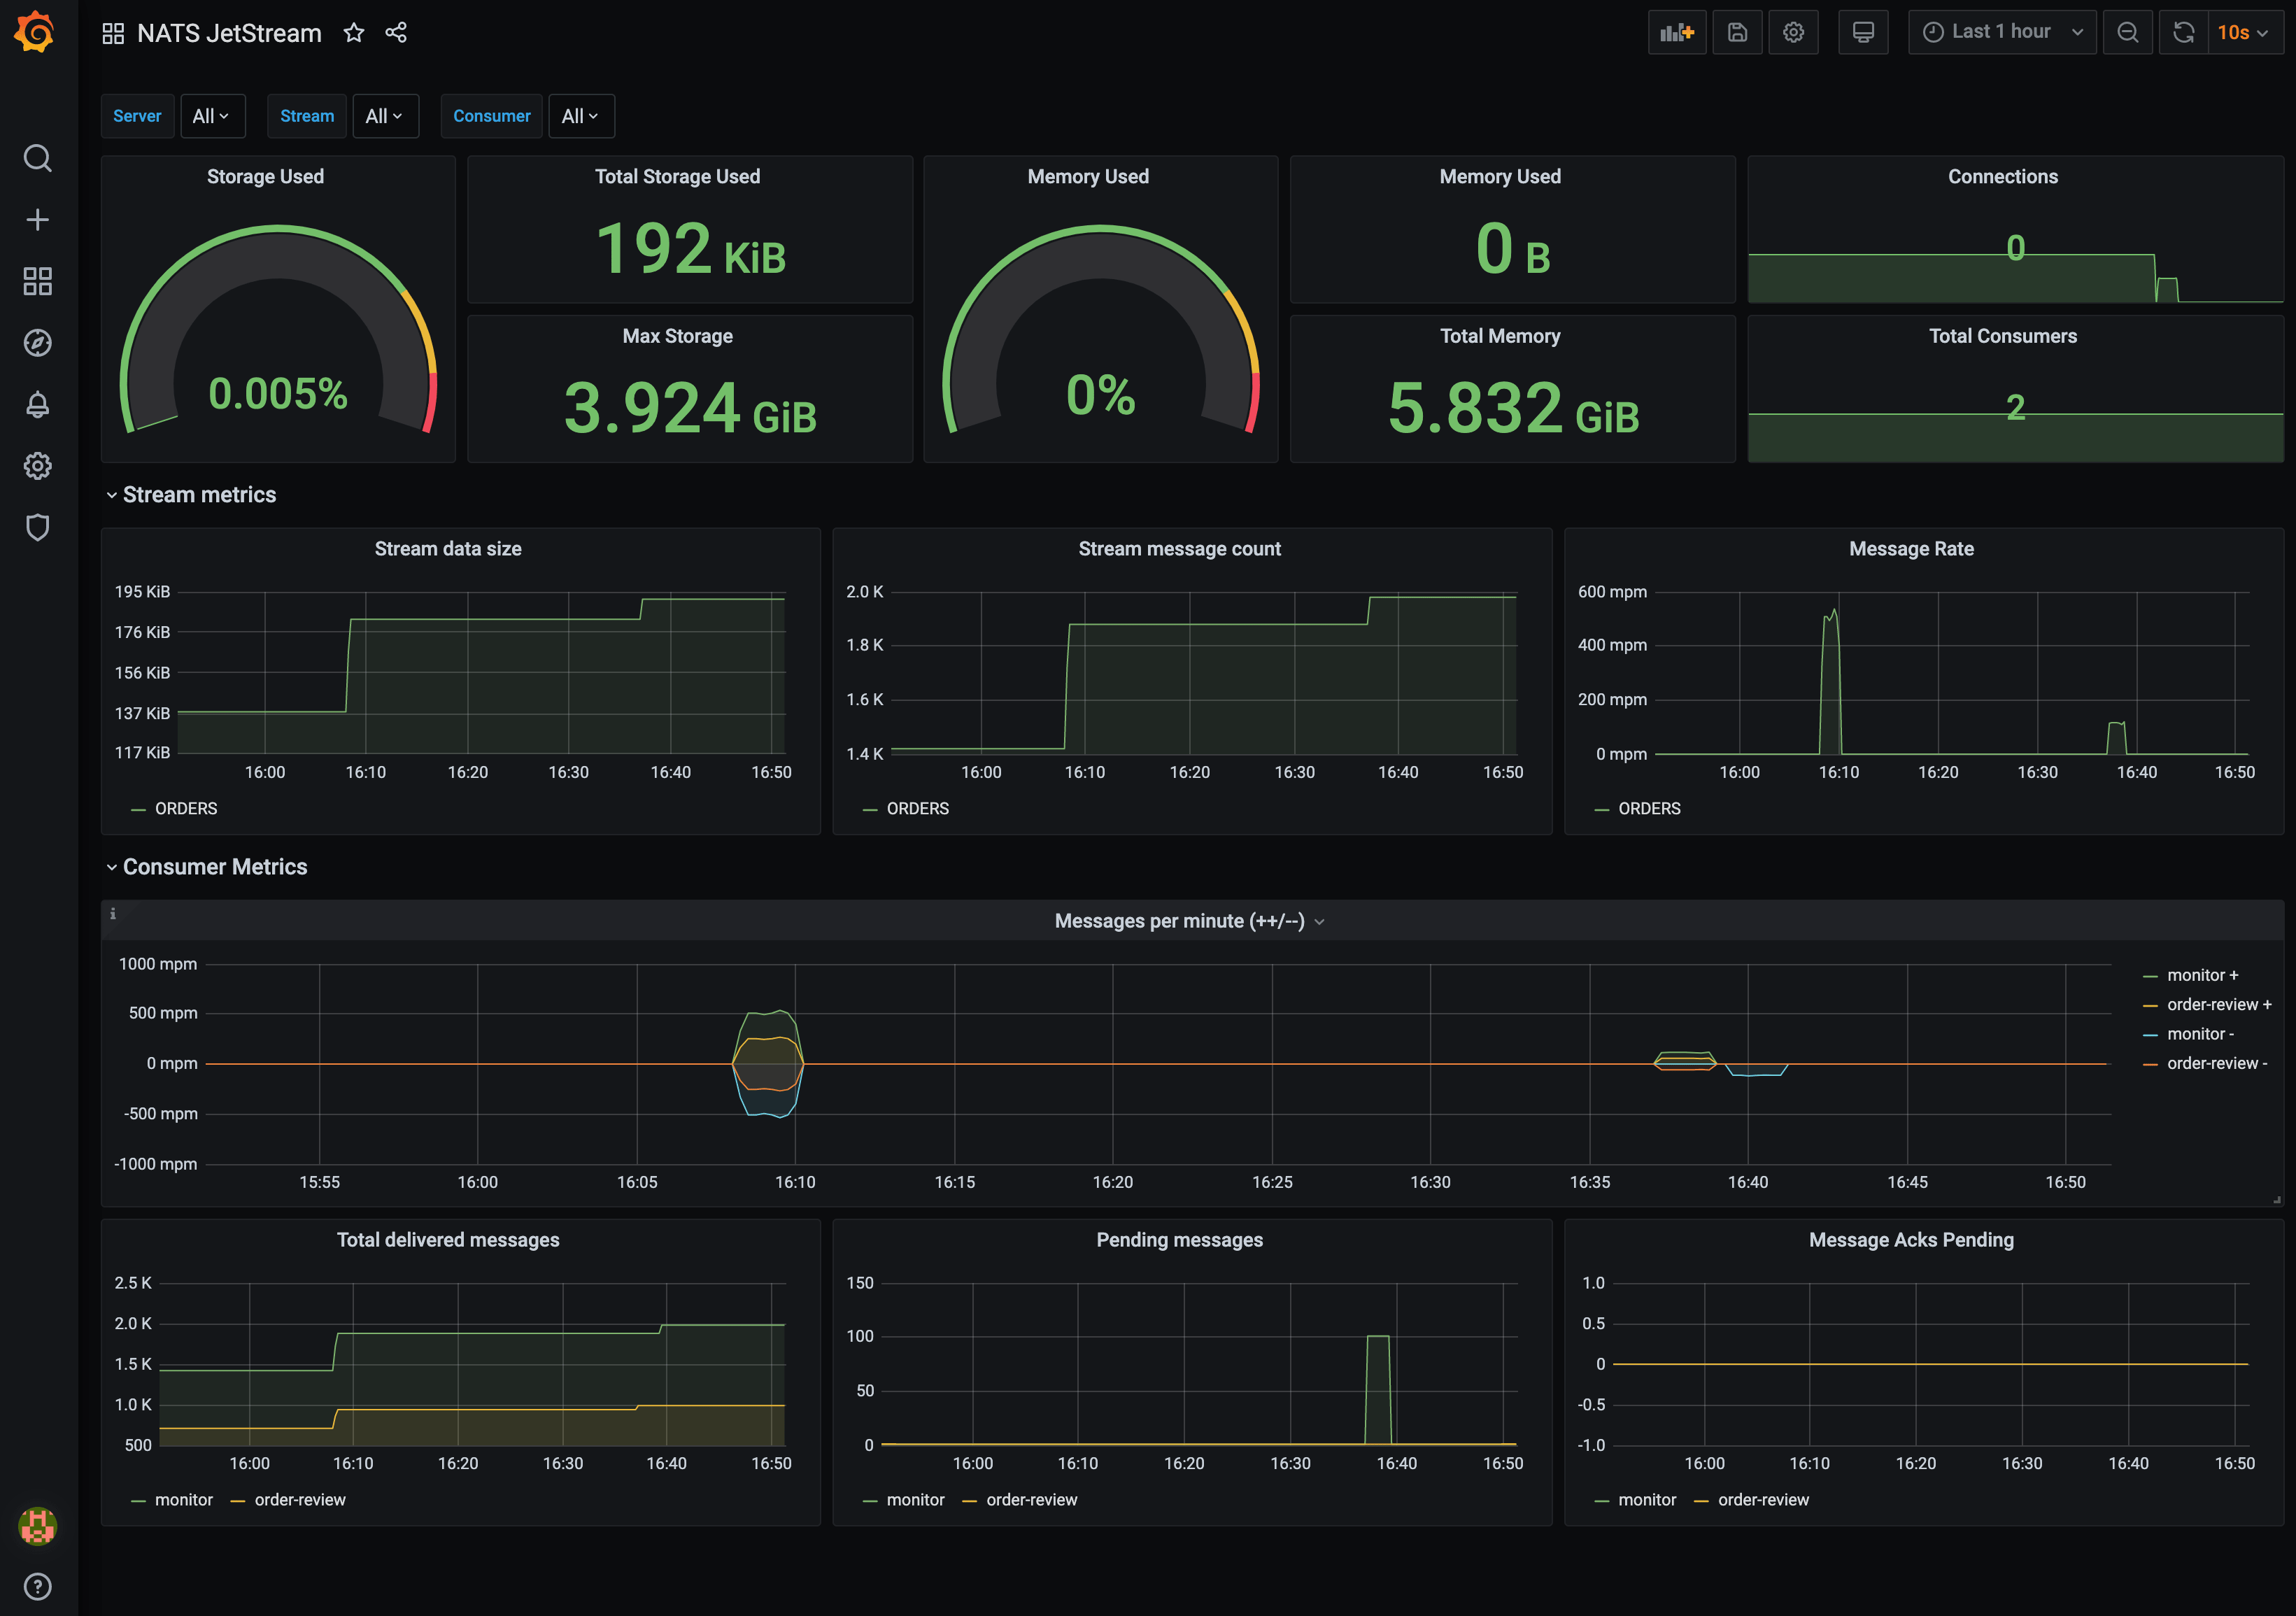
NATS JetStream Dashboard.
Screenshots
Used Metrics 1111
gnatsd_varz_connections
gnatsd_varz_jetstream_config_max_memory
gnatsd_varz_jetstream_config_max_storage
gnatsd_varz_jetstream_stats_memory
gnatsd_varz_jetstream_stats_storage
jetstream_consumer_delivered_consumer_seq
jetstream_consumer_num_ack_pending
jetstream_consumer_num_pending
jetstream_server_total_consumers
jetstream_stream_total_bytes
jetstream_stream_total_messages
Get Dashboard✕
Download
Copy to Clipboard