Named processes stacked 2,4332,433
10/23/2016
10/23/2016
1
Host Metrics
>=3.1.1
Prometheus
Description
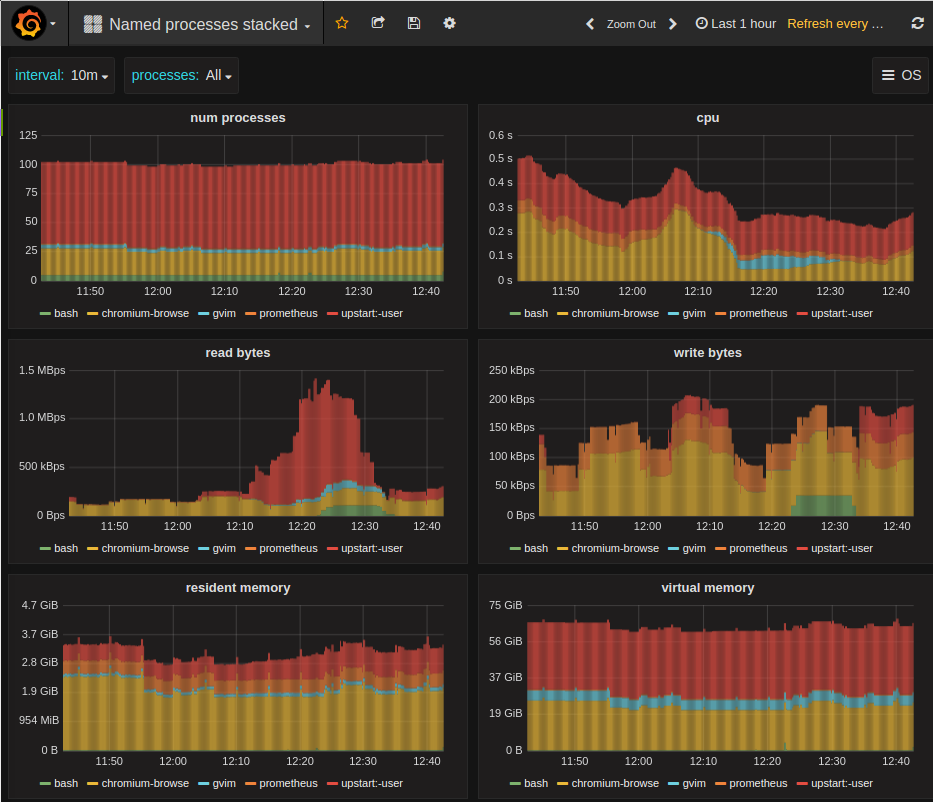
Process metrics exported by https://github.com/ncabatoff/process-exporter, stacked.
Screenshots
Get Dashboard✕
Download
Copy to Clipboard