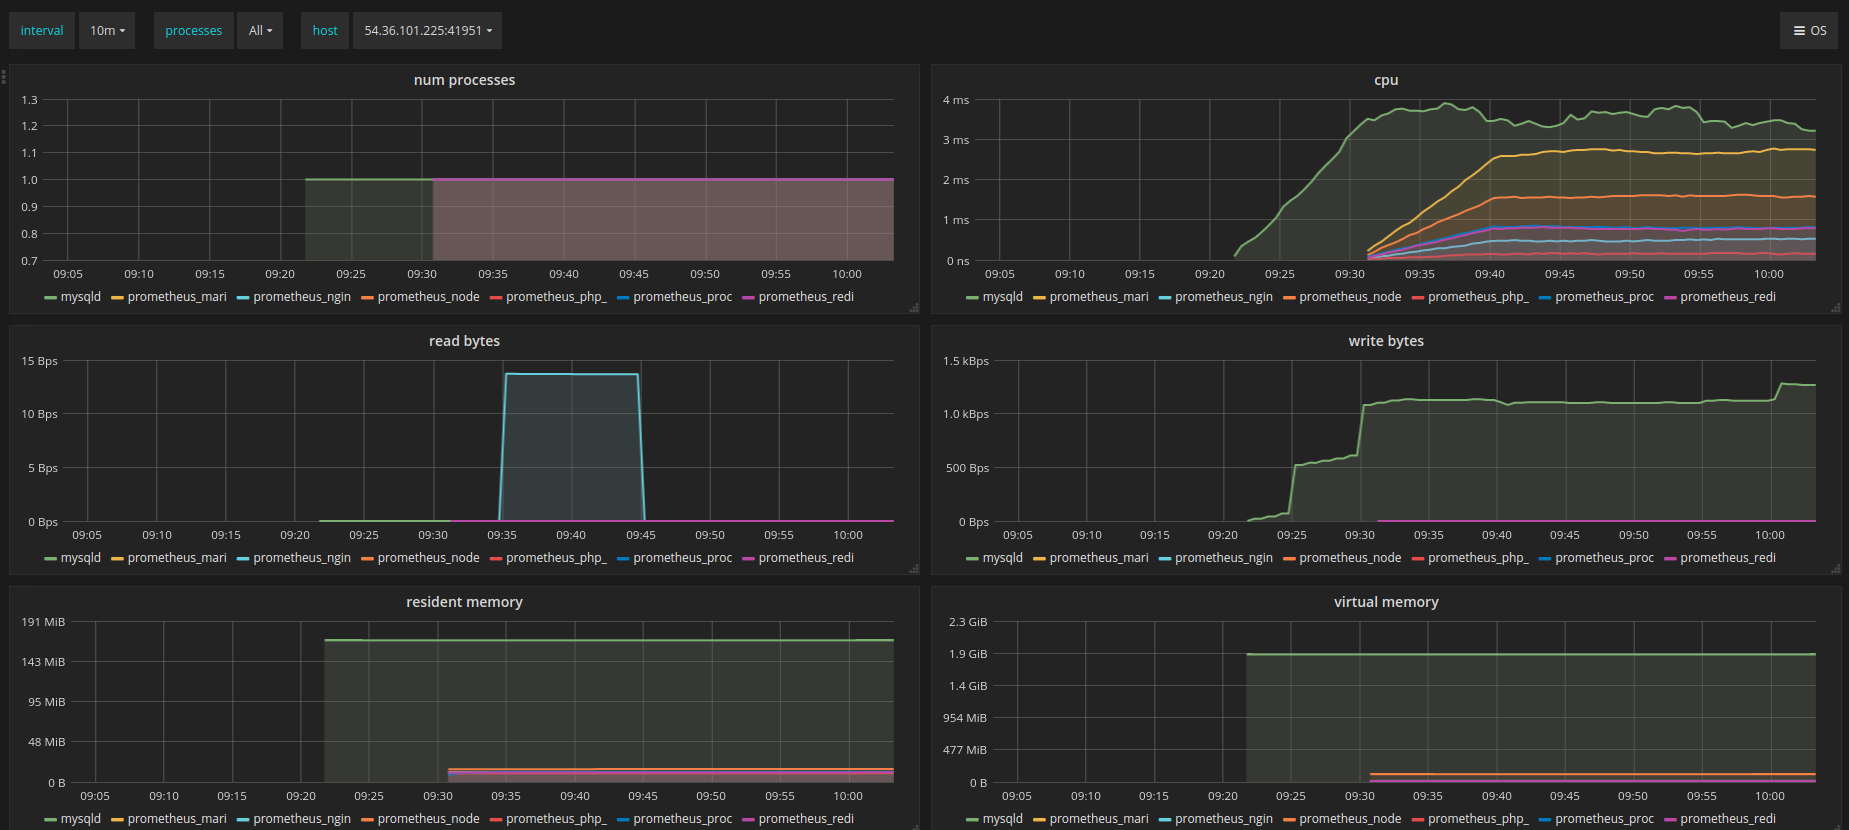
Named processes by host
12,733 5.0 (1 reviews)

Created 1/1/2018
Updated 1/1/2018
Revision 1
Grafana Version >=4.6.2
Datasources
Prometheus

Metrics shown (each broken down by group name and by host): number of processes, memory usage (resident and virtual), CPU consumption, and I/O (bytes read and written).

This is the same data presented in https://grafana.net/dashboards/249 but with with the possibility to filter metrics by host.

Get Dashboard
Download
Copy to Clipboard
Source Grafana.com