Named processes 154,998154,998 5.0 (1 reviews)
7/24/2016
10/23/2016
2
Host Metrics
>=3.1.1
Prometheus
Description
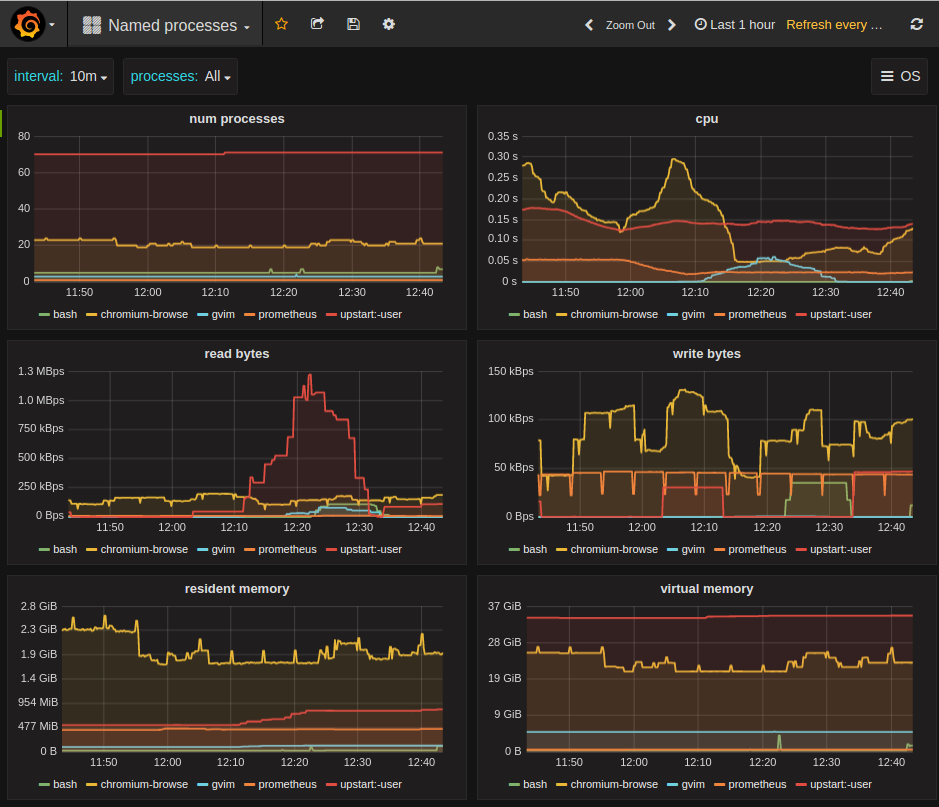
This dashboard monitors process-level metrics to provide visibility into system activity and health. It highlights resource usage and lifecycle events for named processes, with key panels focusing on process CPU usage, memory consumption, and process start/stop counts to identify runaway processes, leaks, or anomalies. Core features include time-series plots for per-process metrics, aggregation controls by process name, and alert-ready thresholds to flag unusual activity.
Screenshots
Get Dashboard✕
Download
Copy to Clipboard