My Polkadot Metrics 821821
6/8/2020
6/8/2020
1
>=7.0.1
Prometheus
Description
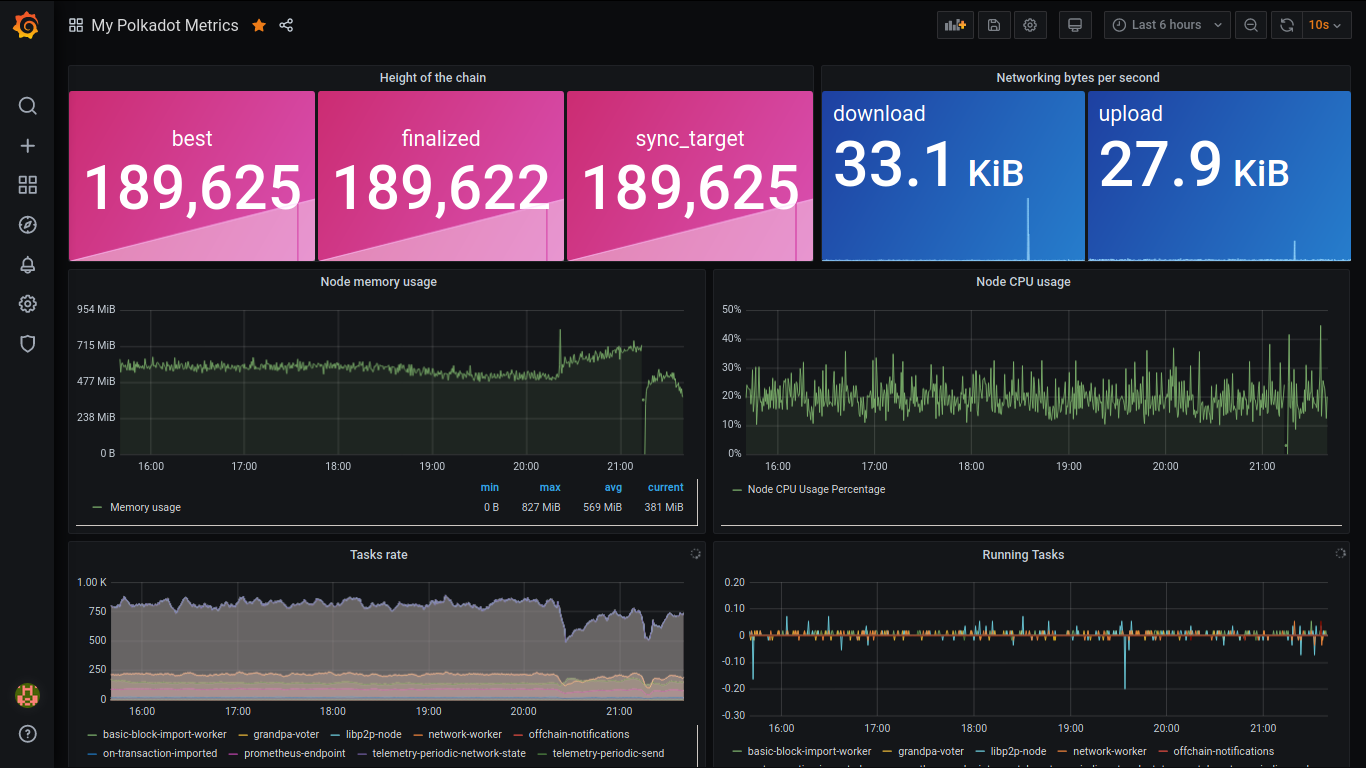
Polkadot network node metrics
Screenshots
Used Metrics 1919
polkadot_block_height
polkadot_cpu_usage_percentage
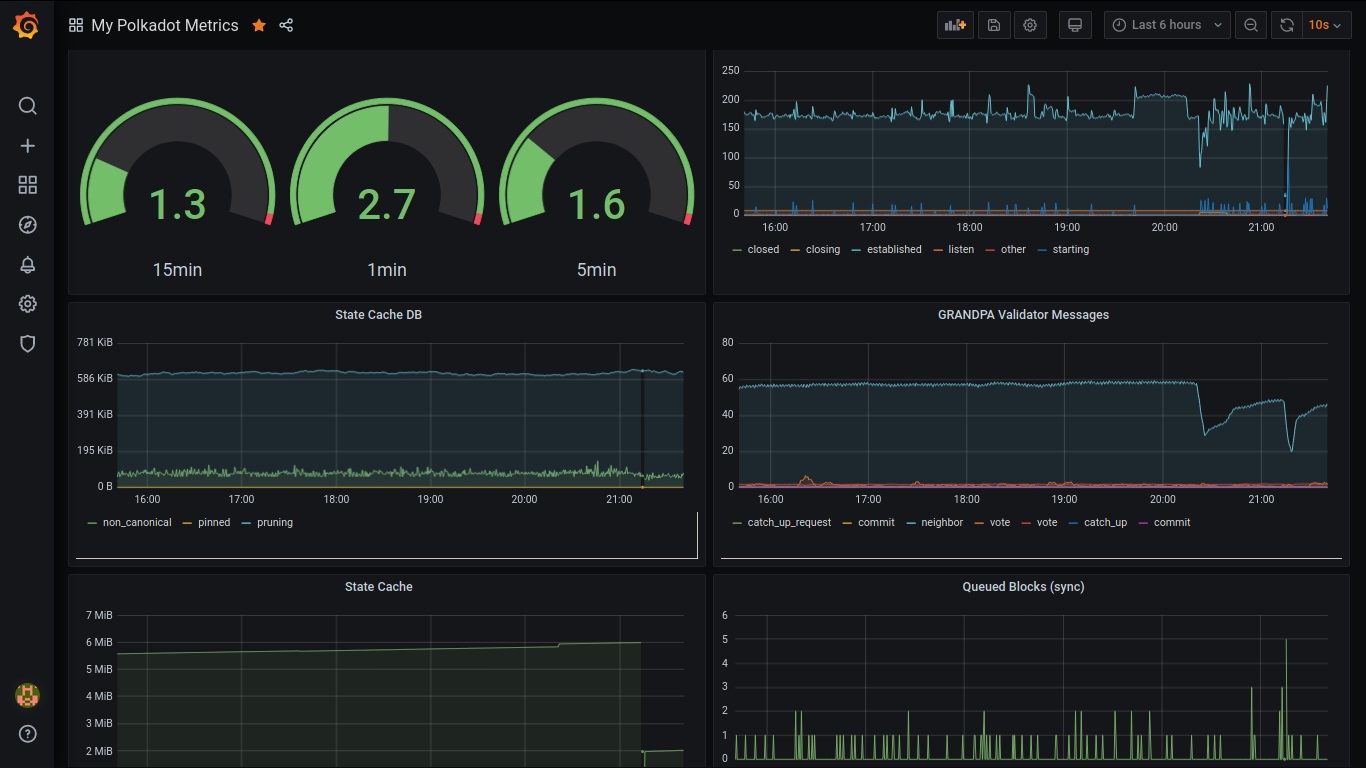
polkadot_finality_grandpa_communication_gossip_validator_messages
polkadot_load_avg
polkadot_memory_usage_bytes
polkadot_netstat_tcp
polkadot_network_per_sec_bytes
polkadot_number_leaves
polkadot_ready_transactions_number
polkadot_state_cache_bytes
polkadot_state_db_cache_bytes
polkadot_sub_libp2p_peers_count
polkadot_sub_libp2p_peerset_num_discovered
polkadot_sub_libp2p_peerset_num_requested
polkadot_sync_peers
polkadot_sync_queued_blocks
polkadot_tasks_polling_duration_bucket
polkadot_tasks_polling_duration_count
polkadot_tasks_polling_started_total
Get Dashboard✕
Download
Copy to Clipboard