Multi Cluster View 3,2533,253
6/20/2023
12/12/2023
7
Databases
>=9.3.2
Description
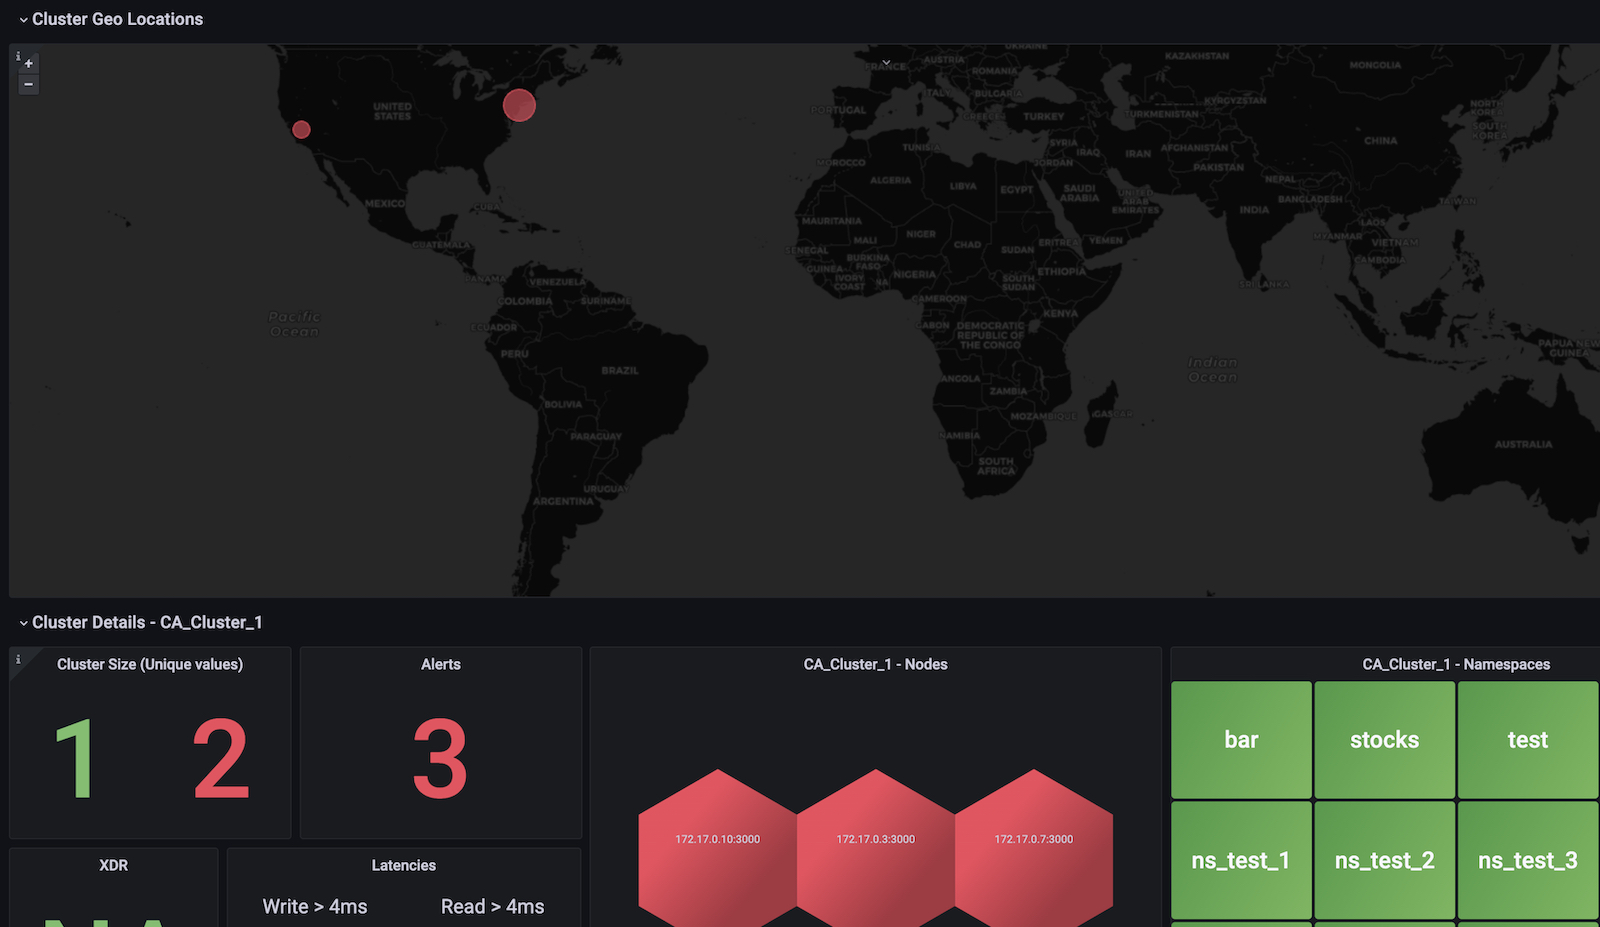
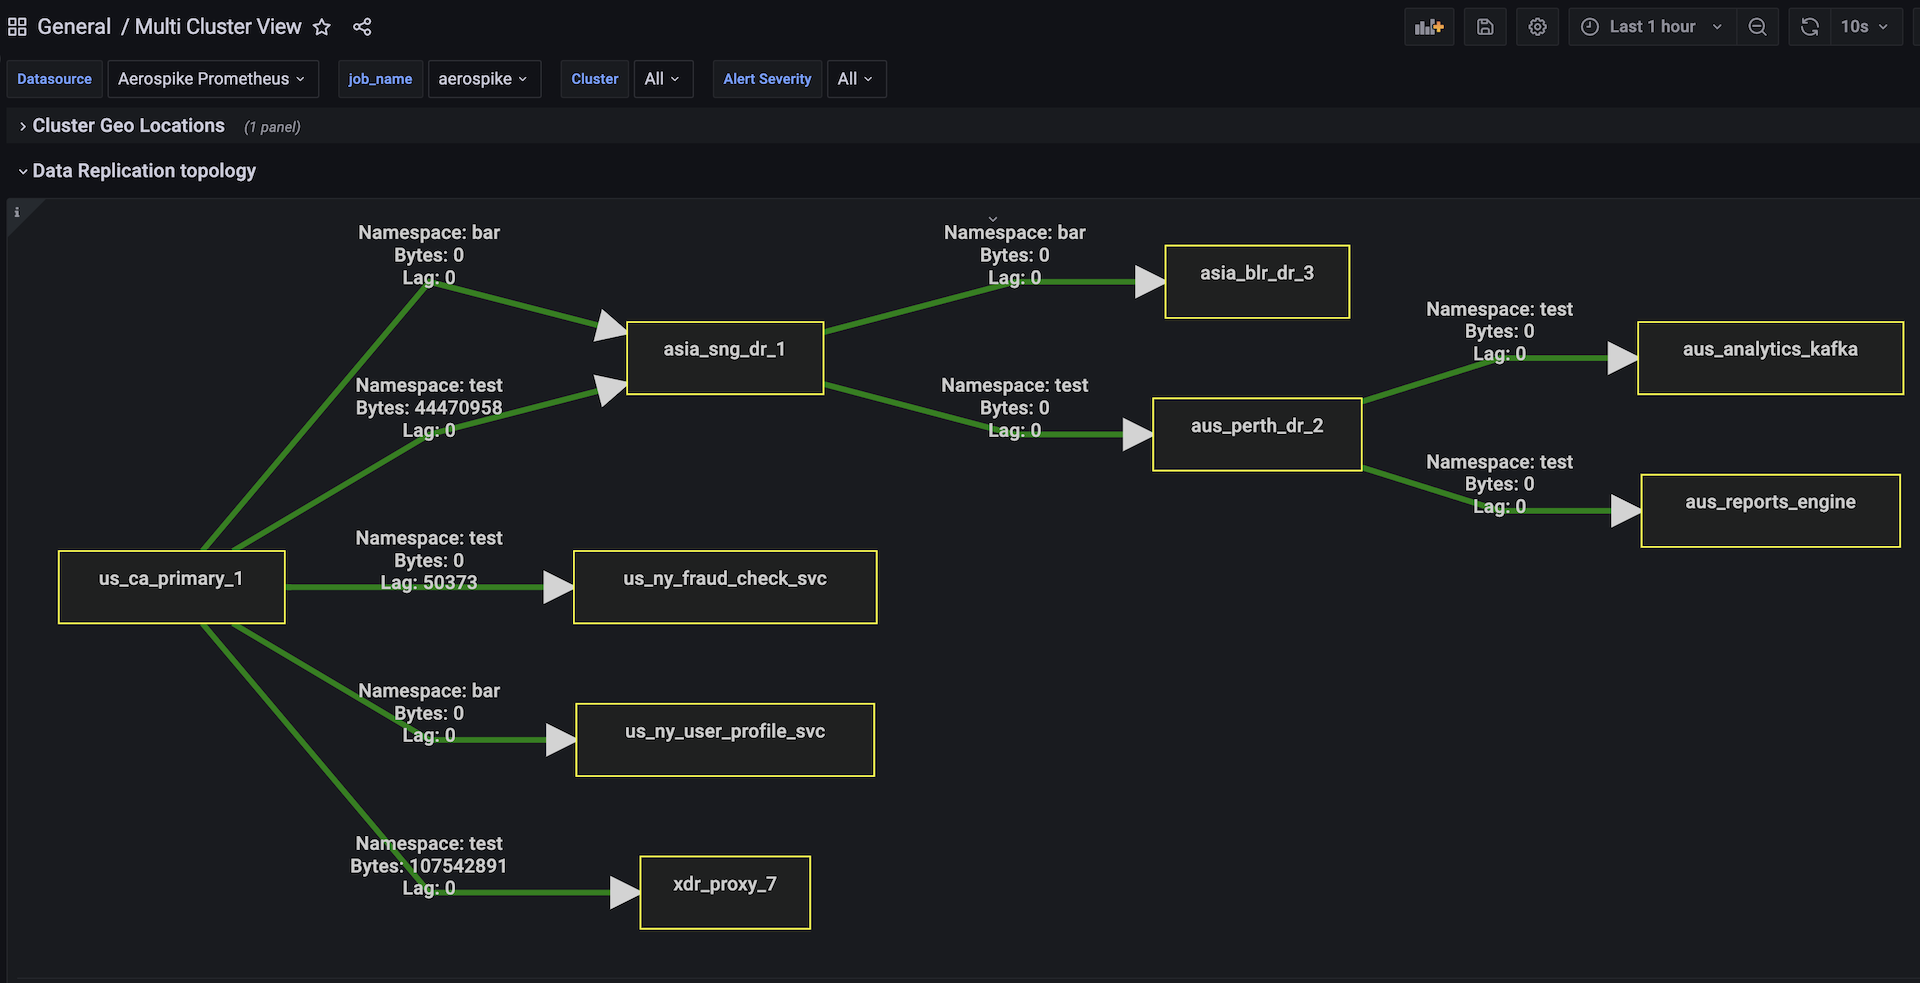
Multi Cluster view dashboard helps visualise multiple clusters across regions and data centers with focus on health as well as alerts and errors associated with them
Screenshots
Used Metrics 88
ALERTS
aerospike_latencies_read_ms_bucket
aerospike_latencies_write_ms_bucket
aerospike_namespace_objects
aerospike_node_stats_cluster_size
aerospike_node_up
aerospike_xdr_lag
size
Get Dashboard✕
Download
Copy to Clipboard