MSK Overview 173,100173,100 5.0 (2 reviews)
Description
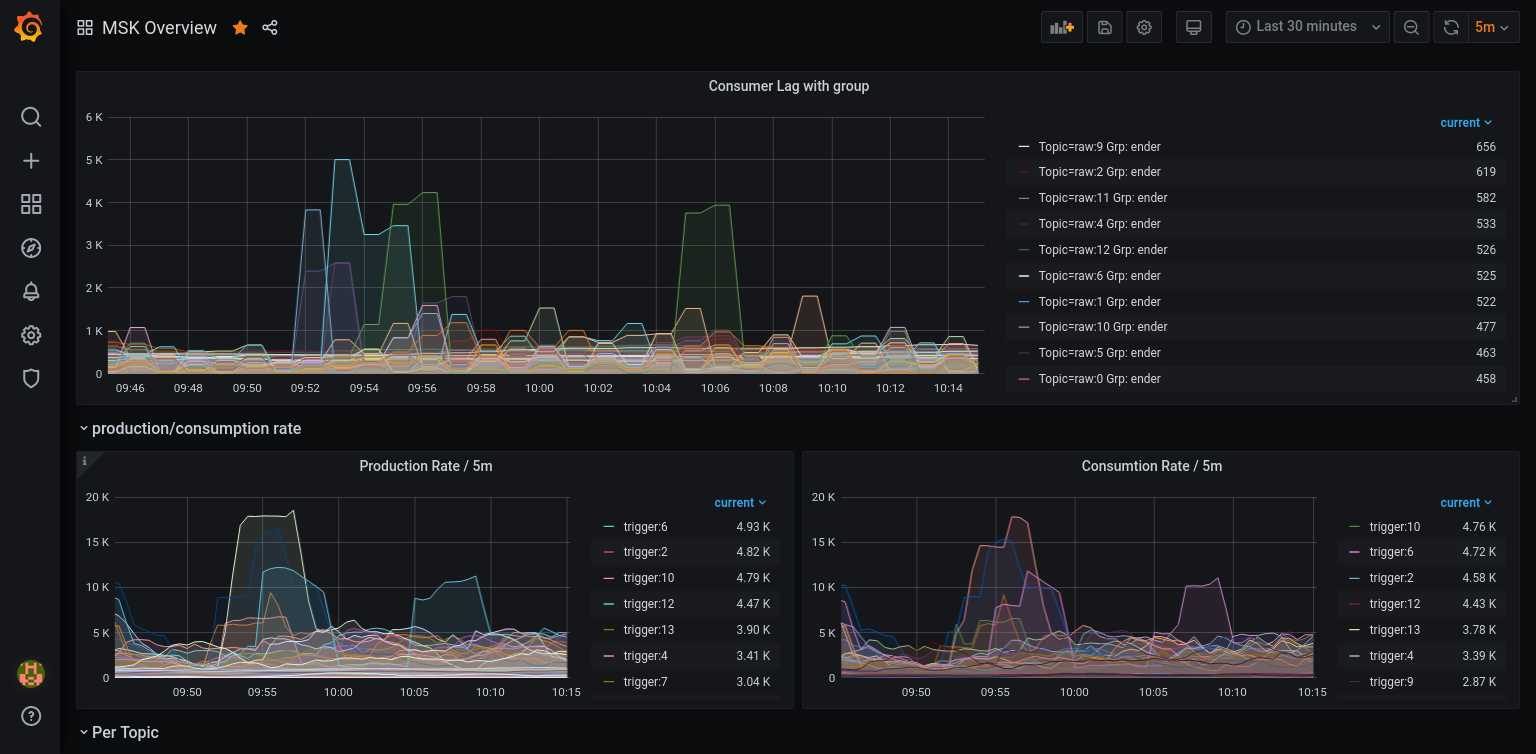
This dashboard provides a real-time view of a Kafka cluster’s health and throughput, including consumer lag, production/consumption rates, and data ingress/egress. It highlights resource utilization with metrics like node_cpu_seconds_total and node_filesystem_avail_bytes, and tracks key Kafka indicators such as kafka_consumer_group_ConsumerLagMetrics_Value, kafka_network_RequestMetrics_Count, and kafka_server_BrokerTopicMetrics_Count to surface latency, throughput, and partition status. Overall, it combines availability and throughput signals to help operators spot bottlenecks, under-replicated partitions, and ISR issues at a glance.
Screenshots
Used Metrics 77
kafka_consumer_group_ConsumerLagMetrics_Value
kafka_log_Log_Value
kafka_network_RequestMetrics_Count
kafka_server_BrokerTopicMetrics_Count
kafka_server_ReplicaManager_Value
-
node_cpu_seconds_total
-
node_filesystem_avail_bytes