Monitoring Golden Signals for Kubernetes 1,1181,118
Description
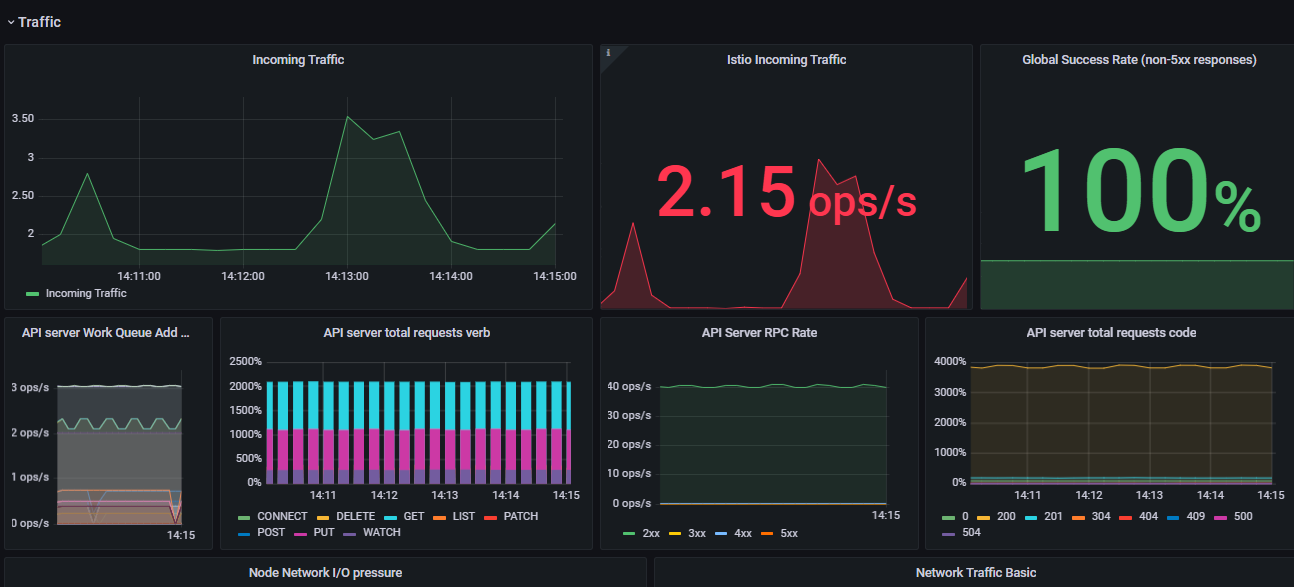
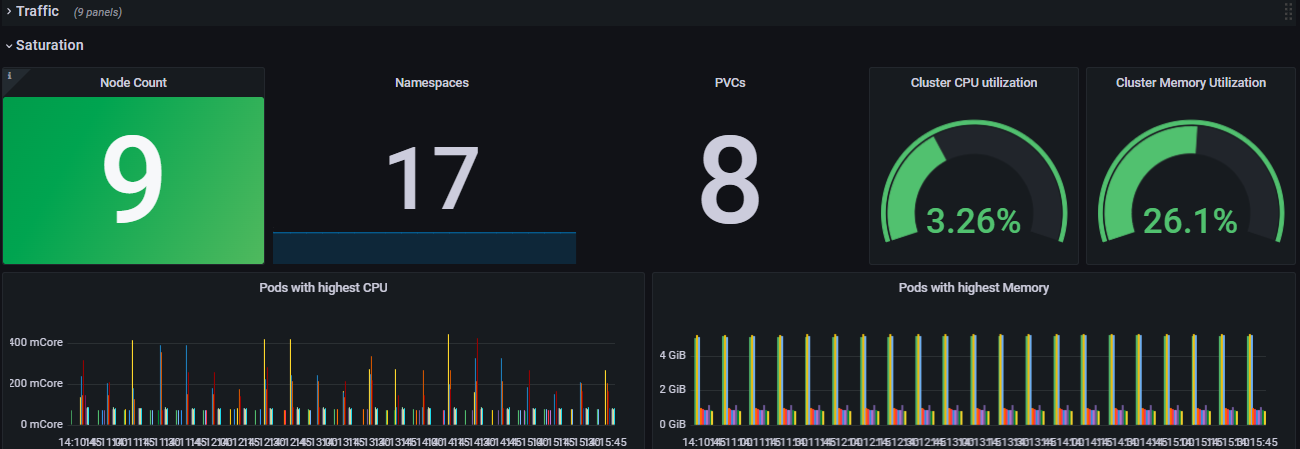
This comprehensive Grafana dashboard provides a detailed view of the key metrics that can be categorized under the Four Golden Signals: Latency, Traffic, Errors, and Saturation. Designed for quick issue identification, this dashboard offers real-time insights into the performance and health of your Kubernetes cluster. Ideal for DevOps teams and SREs, this dashboard is your go-to resource for proactive Kubernetes cluster management.
Screenshots
Used Metrics 5757
Lost
Pending
apiserver_request_duration_seconds_bucket
apiserver_request_total
-
container_cpu_cfs_throttled_periods_total
-
container_cpu_usage_seconds_total
-
container_memory_working_set_bytes
-
container_network_receive_bytes_total
-
container_network_transmit_bytes_total
coredns_cache_misses_total
coredns_dns_request_duration_seconds_bucket
coredns_dns_requests_total
etcd_request_duration_seconds_bucket
istio_requests_total
kube_job_status_active
kube_job_status_failed
kube_job_status_succeeded
kube_namespace_created
kube_node_labels
kube_node_spec_unschedulable
kube_node_status_condition
kube_persistentvolumeclaim_info
kube_persistentvolumeclaim_status_phase
kube_pod_container_status_restarts
kube_pod_container_status_waiting
kube_pod_info
kube_pod_status_phase
kube_storageclass_info
kubelet_node_name
kubelet_pod_start_duration_seconds_bucket
kubelet_pod_worker_duration_seconds_bucket
kubelet_runtime_operations_errors_total
kubelet_volume_stats_available_bytes
kubelet_volume_stats_capacity_bytes
kubelet_volume_stats_used_bytes
nginx_ingress_controller_nginx_process_connections
nginx_ingress_controller_requests
node
-
node_cpu_seconds_total
-
node_filefd_allocated
-
node_filefd_maximum
-
node_memory_Buffers_bytes
-
node_memory_Cached_bytes
-
node_memory_MemFree_bytes
-
node_memory_MemTotal_bytes
-
node_network_receive_bytes_total
-
node_network_receive_errs_total
-
node_network_transmit_bytes_total
-
node_network_transmit_errs_total
node_nf_conntrack_entries
node_nf_conntrack_entries_limit
-
node_sockstat_sockets_used
phase
topk
workqueue_adds_total
workqueue_depth
workqueue_queue_duration_seconds_bucket