MongoDB Profiler Exporter 901901
1/31/2024
8/9/2024
7
Databases
>=9.2.15
Prometheus
Description
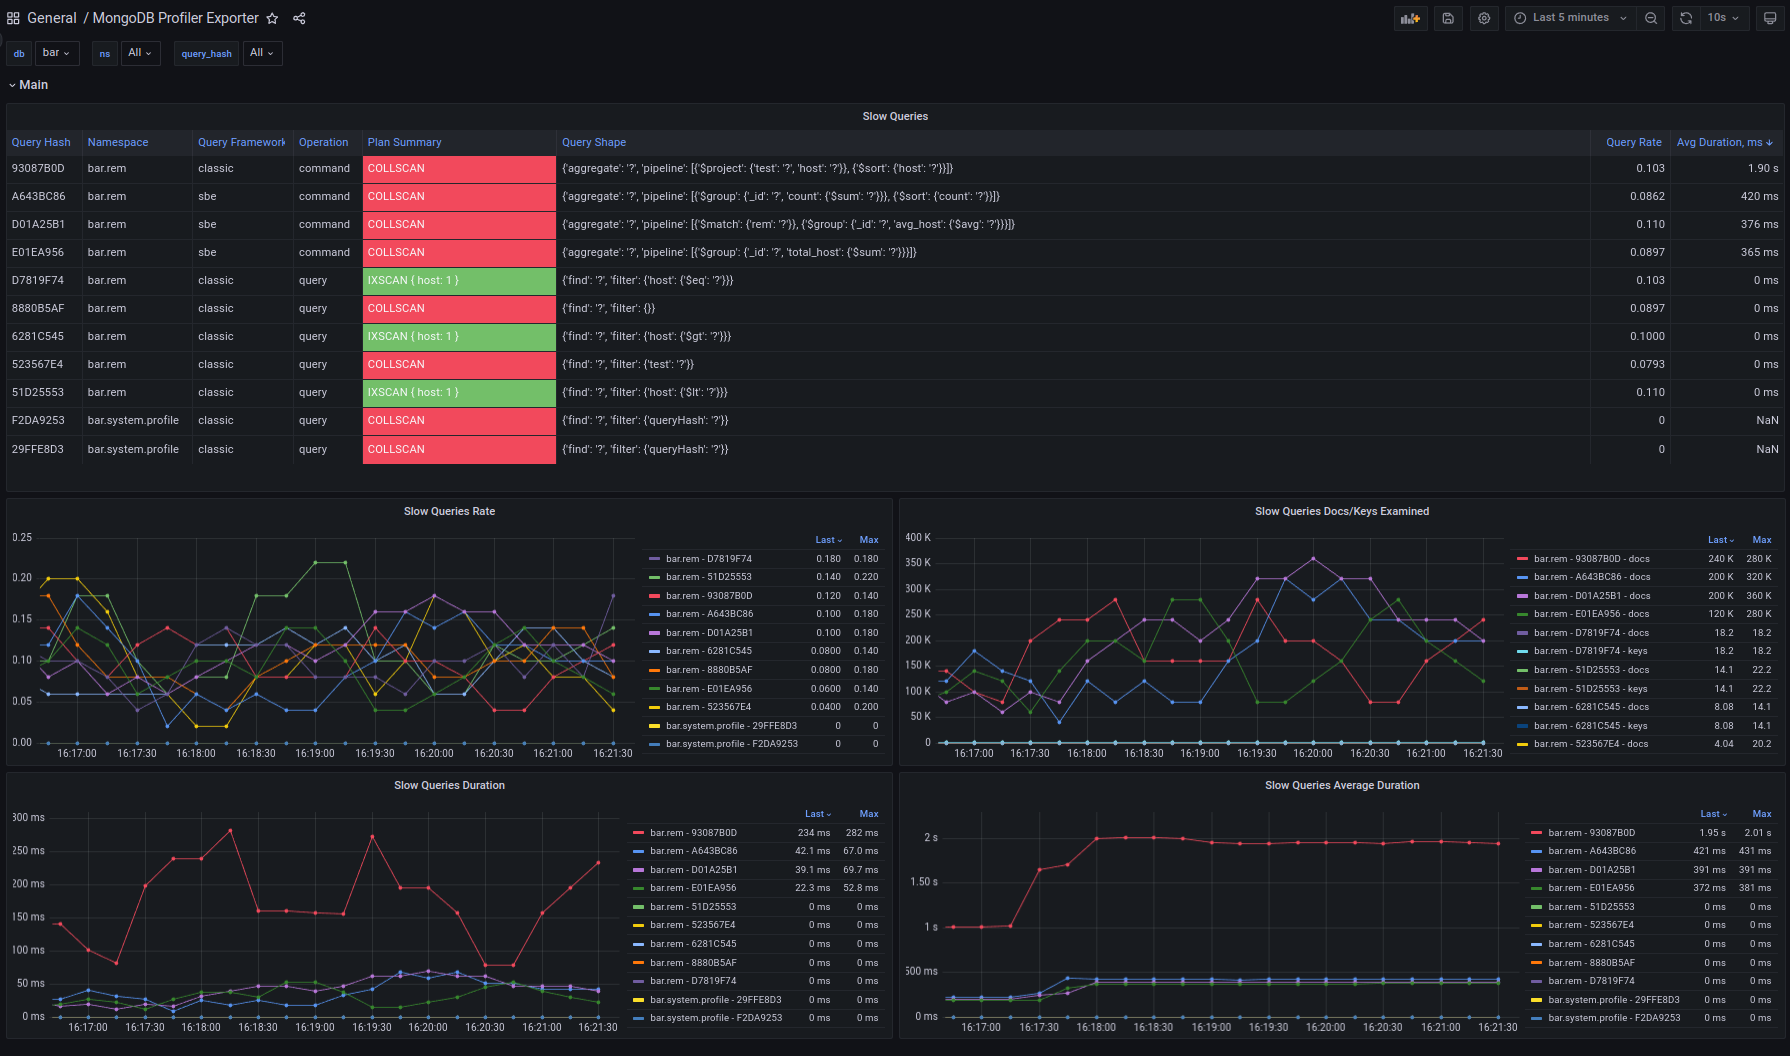
Mongo DB Profiler Prometheus Exporter. Check https://github.com/andrii29/mongodb-profiler-exporter for additional info
Screenshots
Used Metrics 1212
Inf
op
plan_summary
query_framework
query_shape
slow_queries_count_total
slow_queries_docs_examined_total
slow_queries_duration_total
slow_queries_info
slow_queries_keys_examined_total
slow_queries_nreturned_total
topk
Get Dashboard✕
Download
Copy to Clipboard