MongoDB 22,168,50722,168,507 3.7 (3 reviews)
7/5/2017
11/4/2020
2
Databases
>=4.4.3
Prometheus
Description
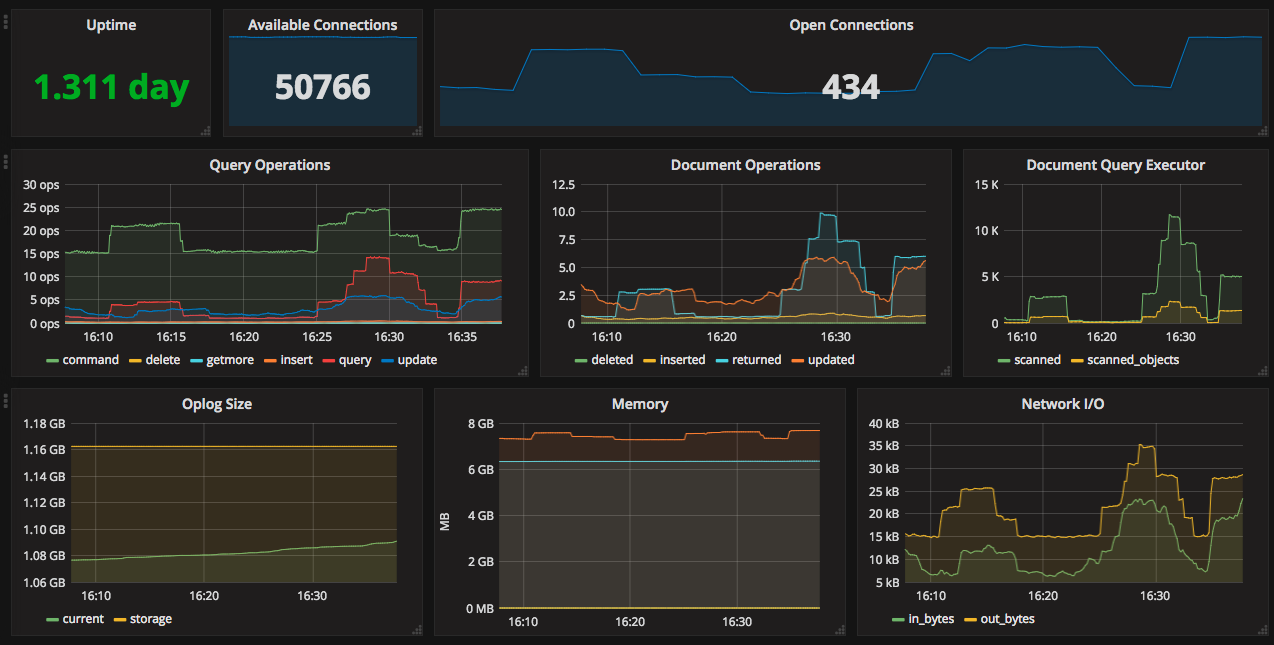
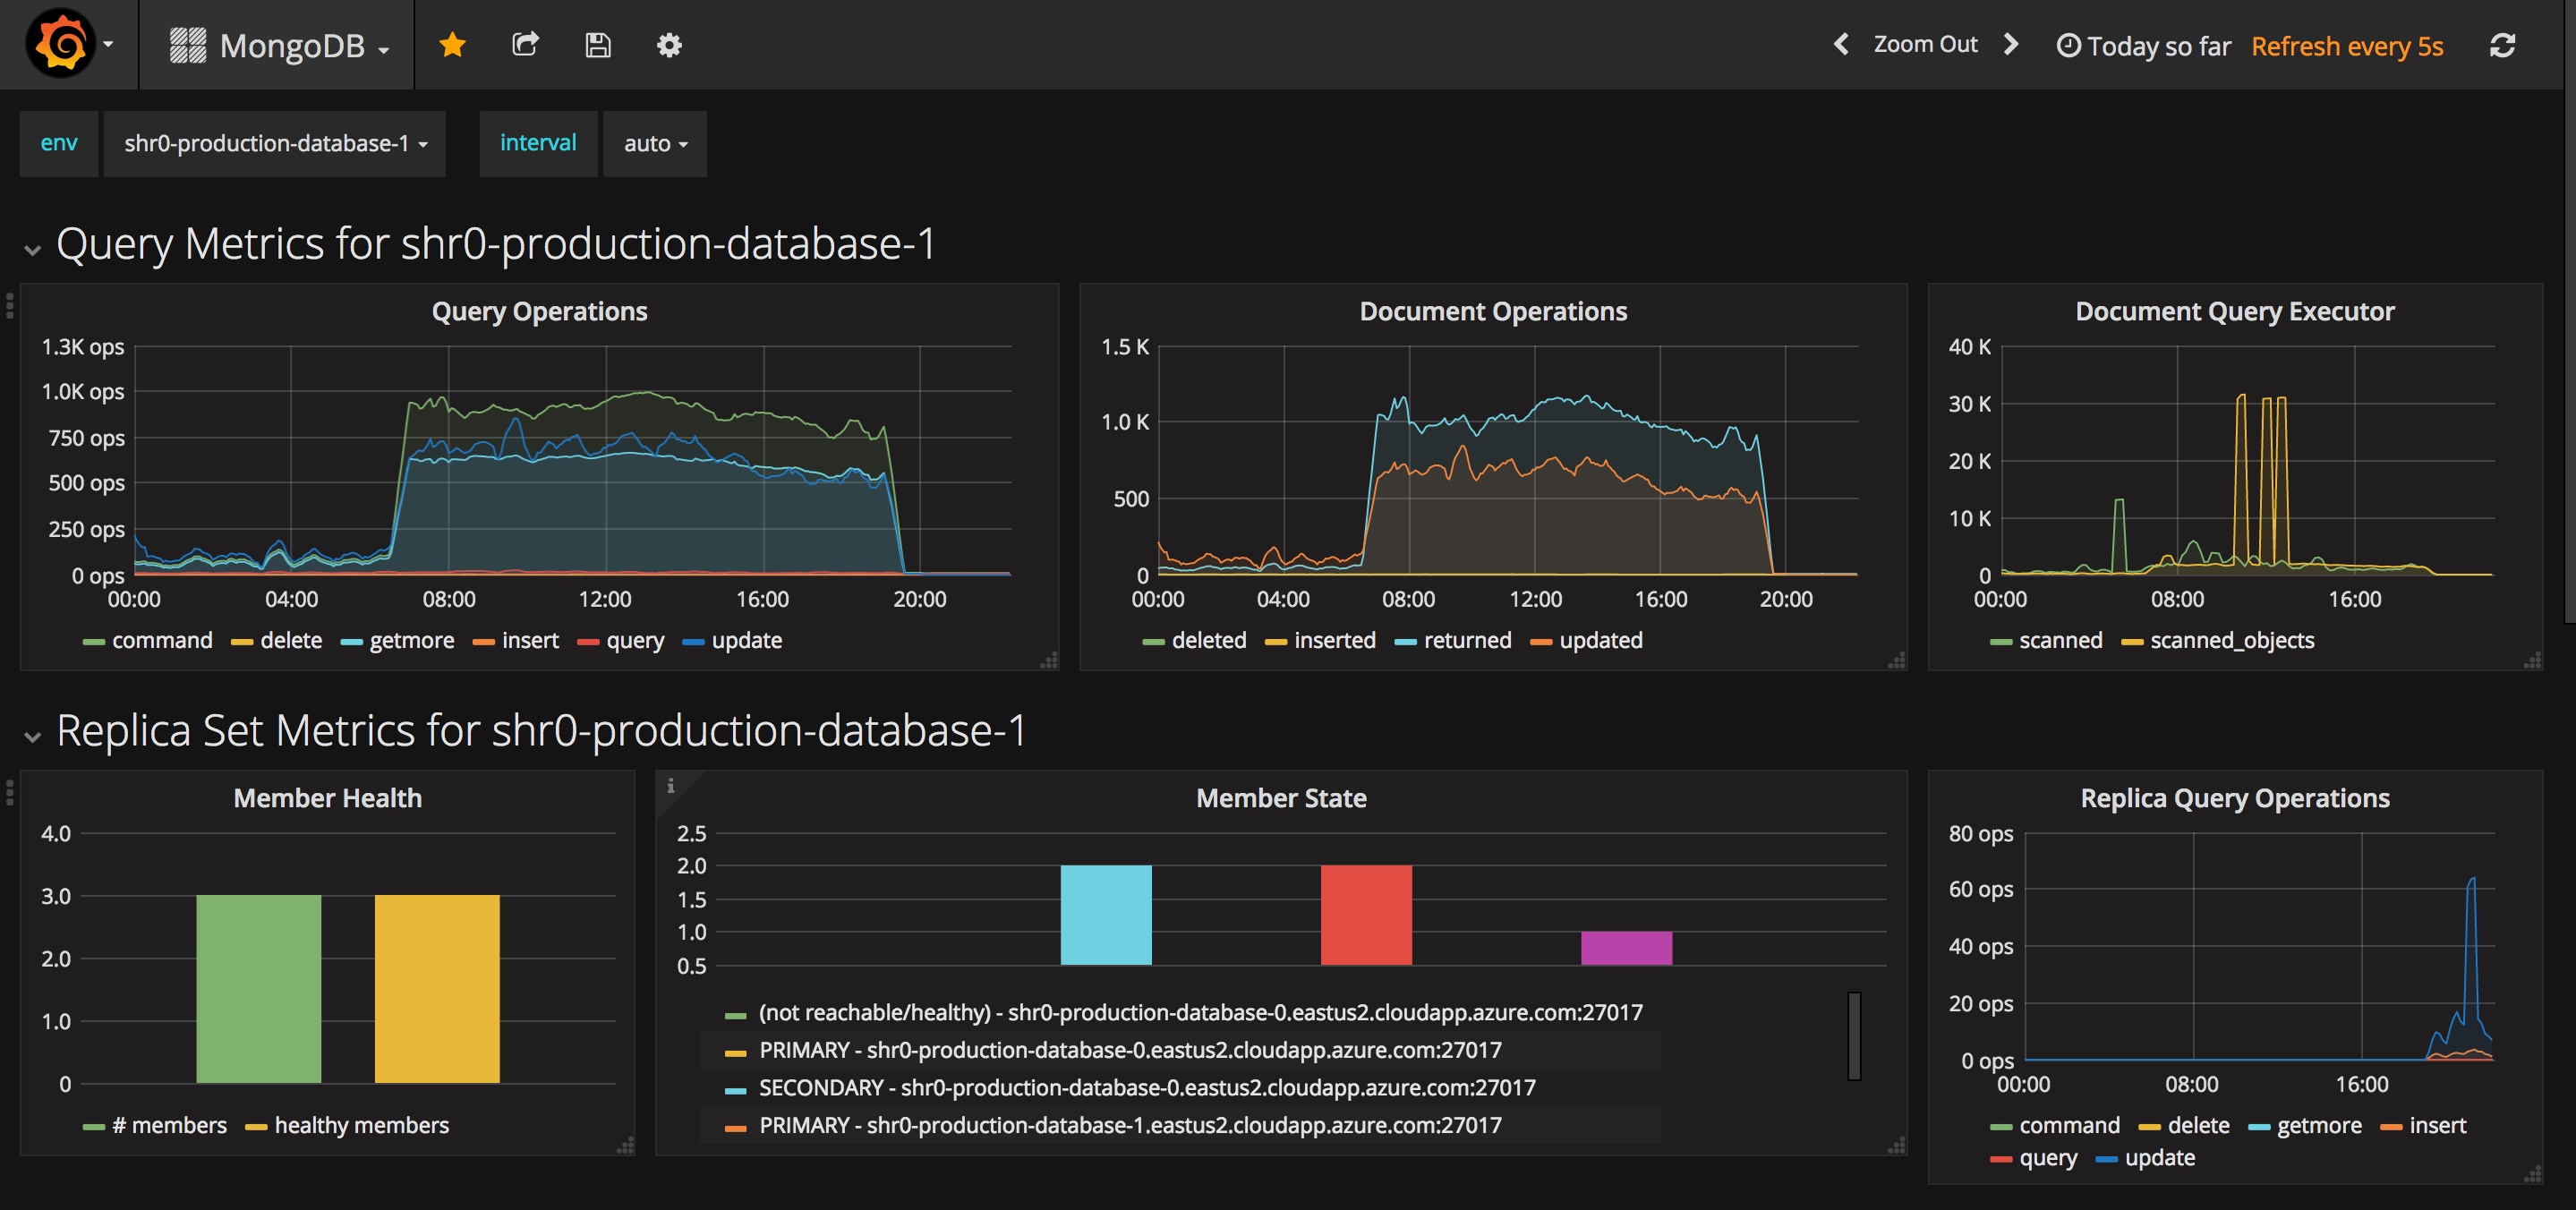
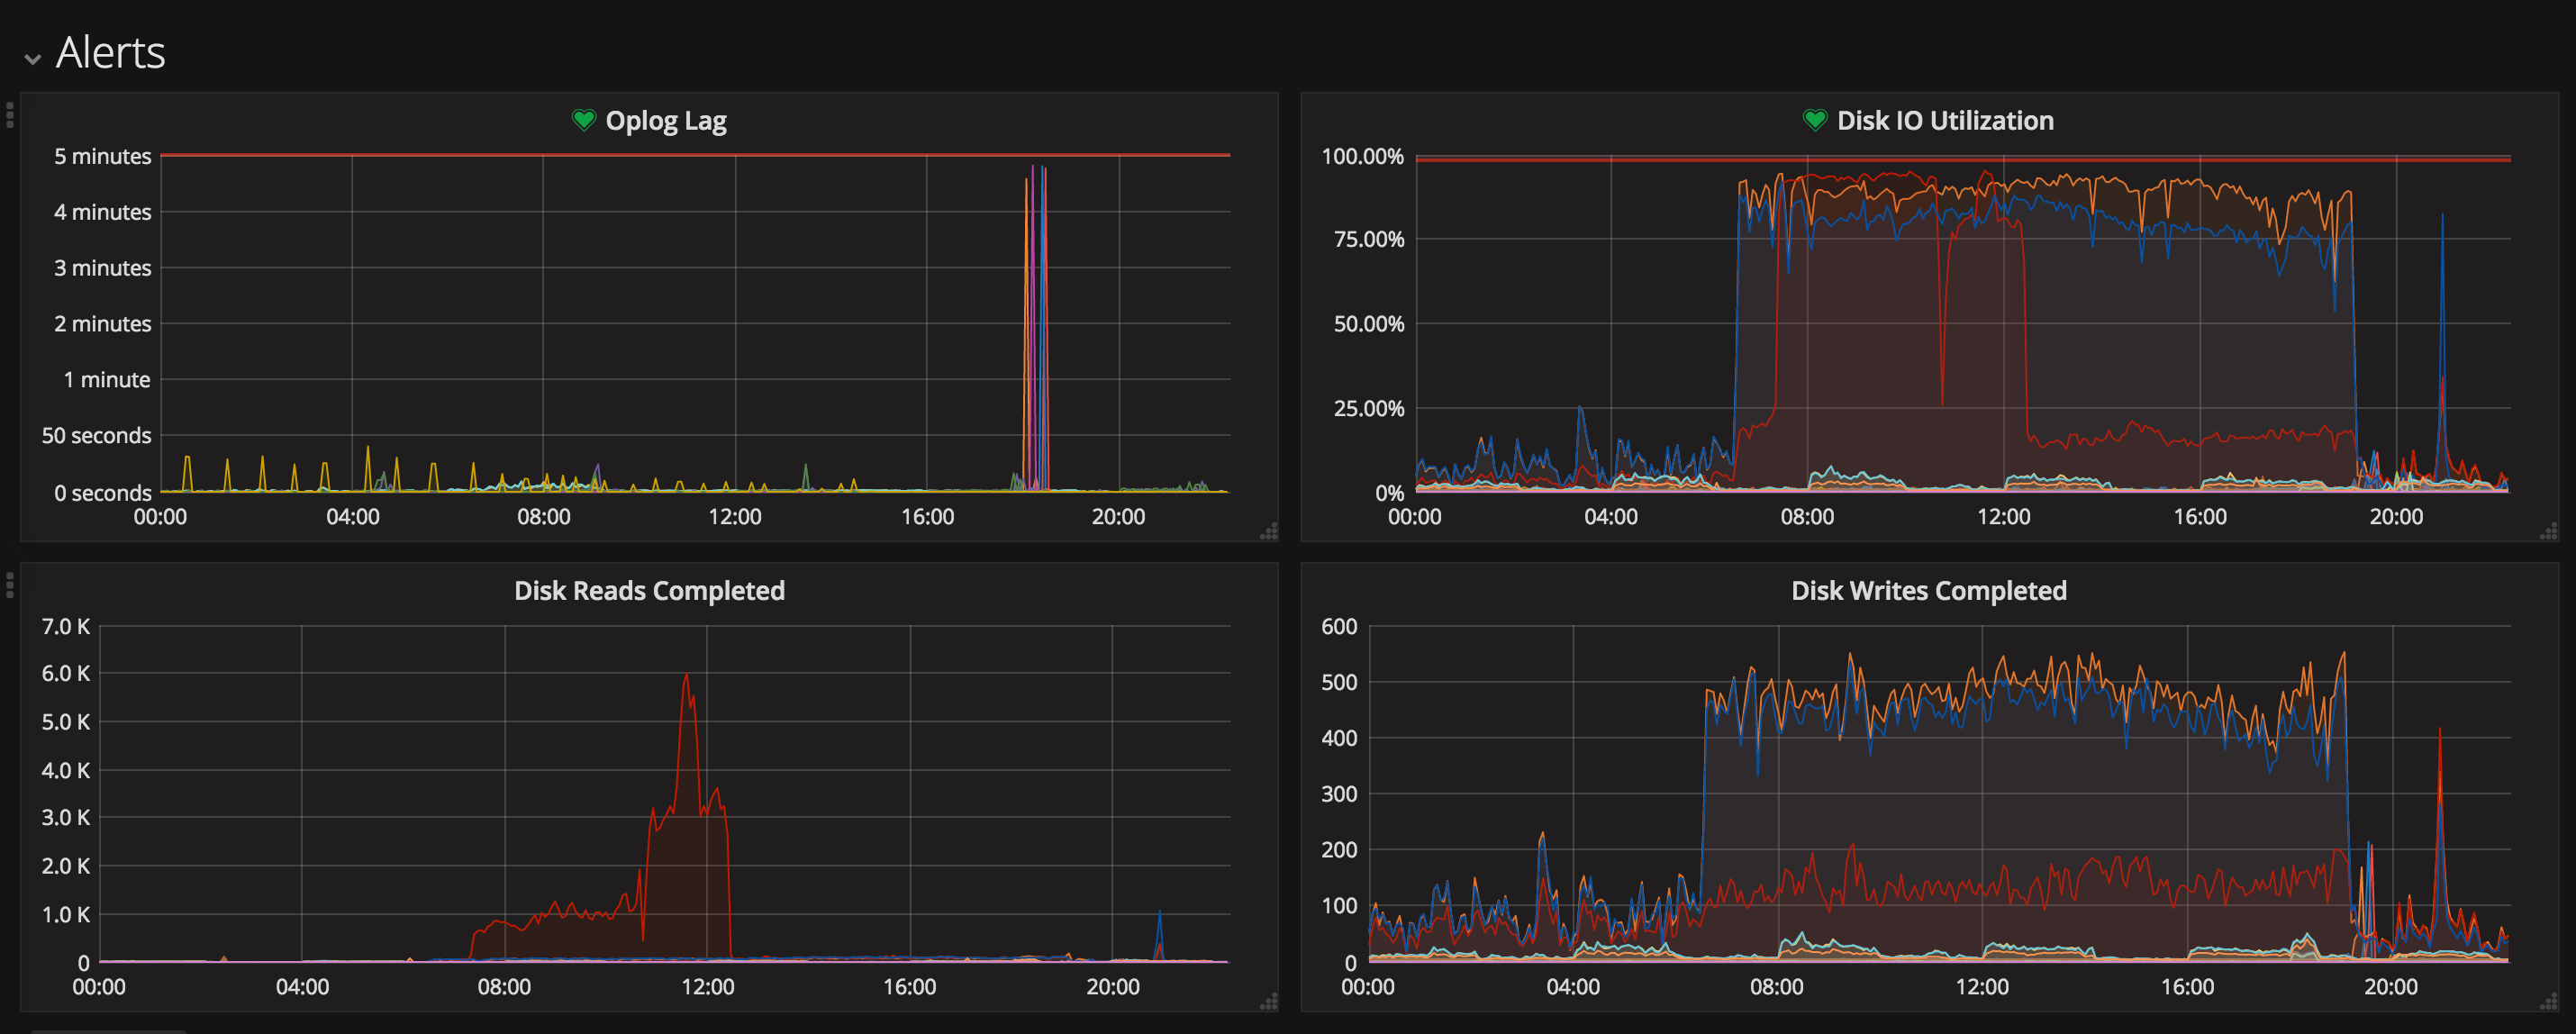
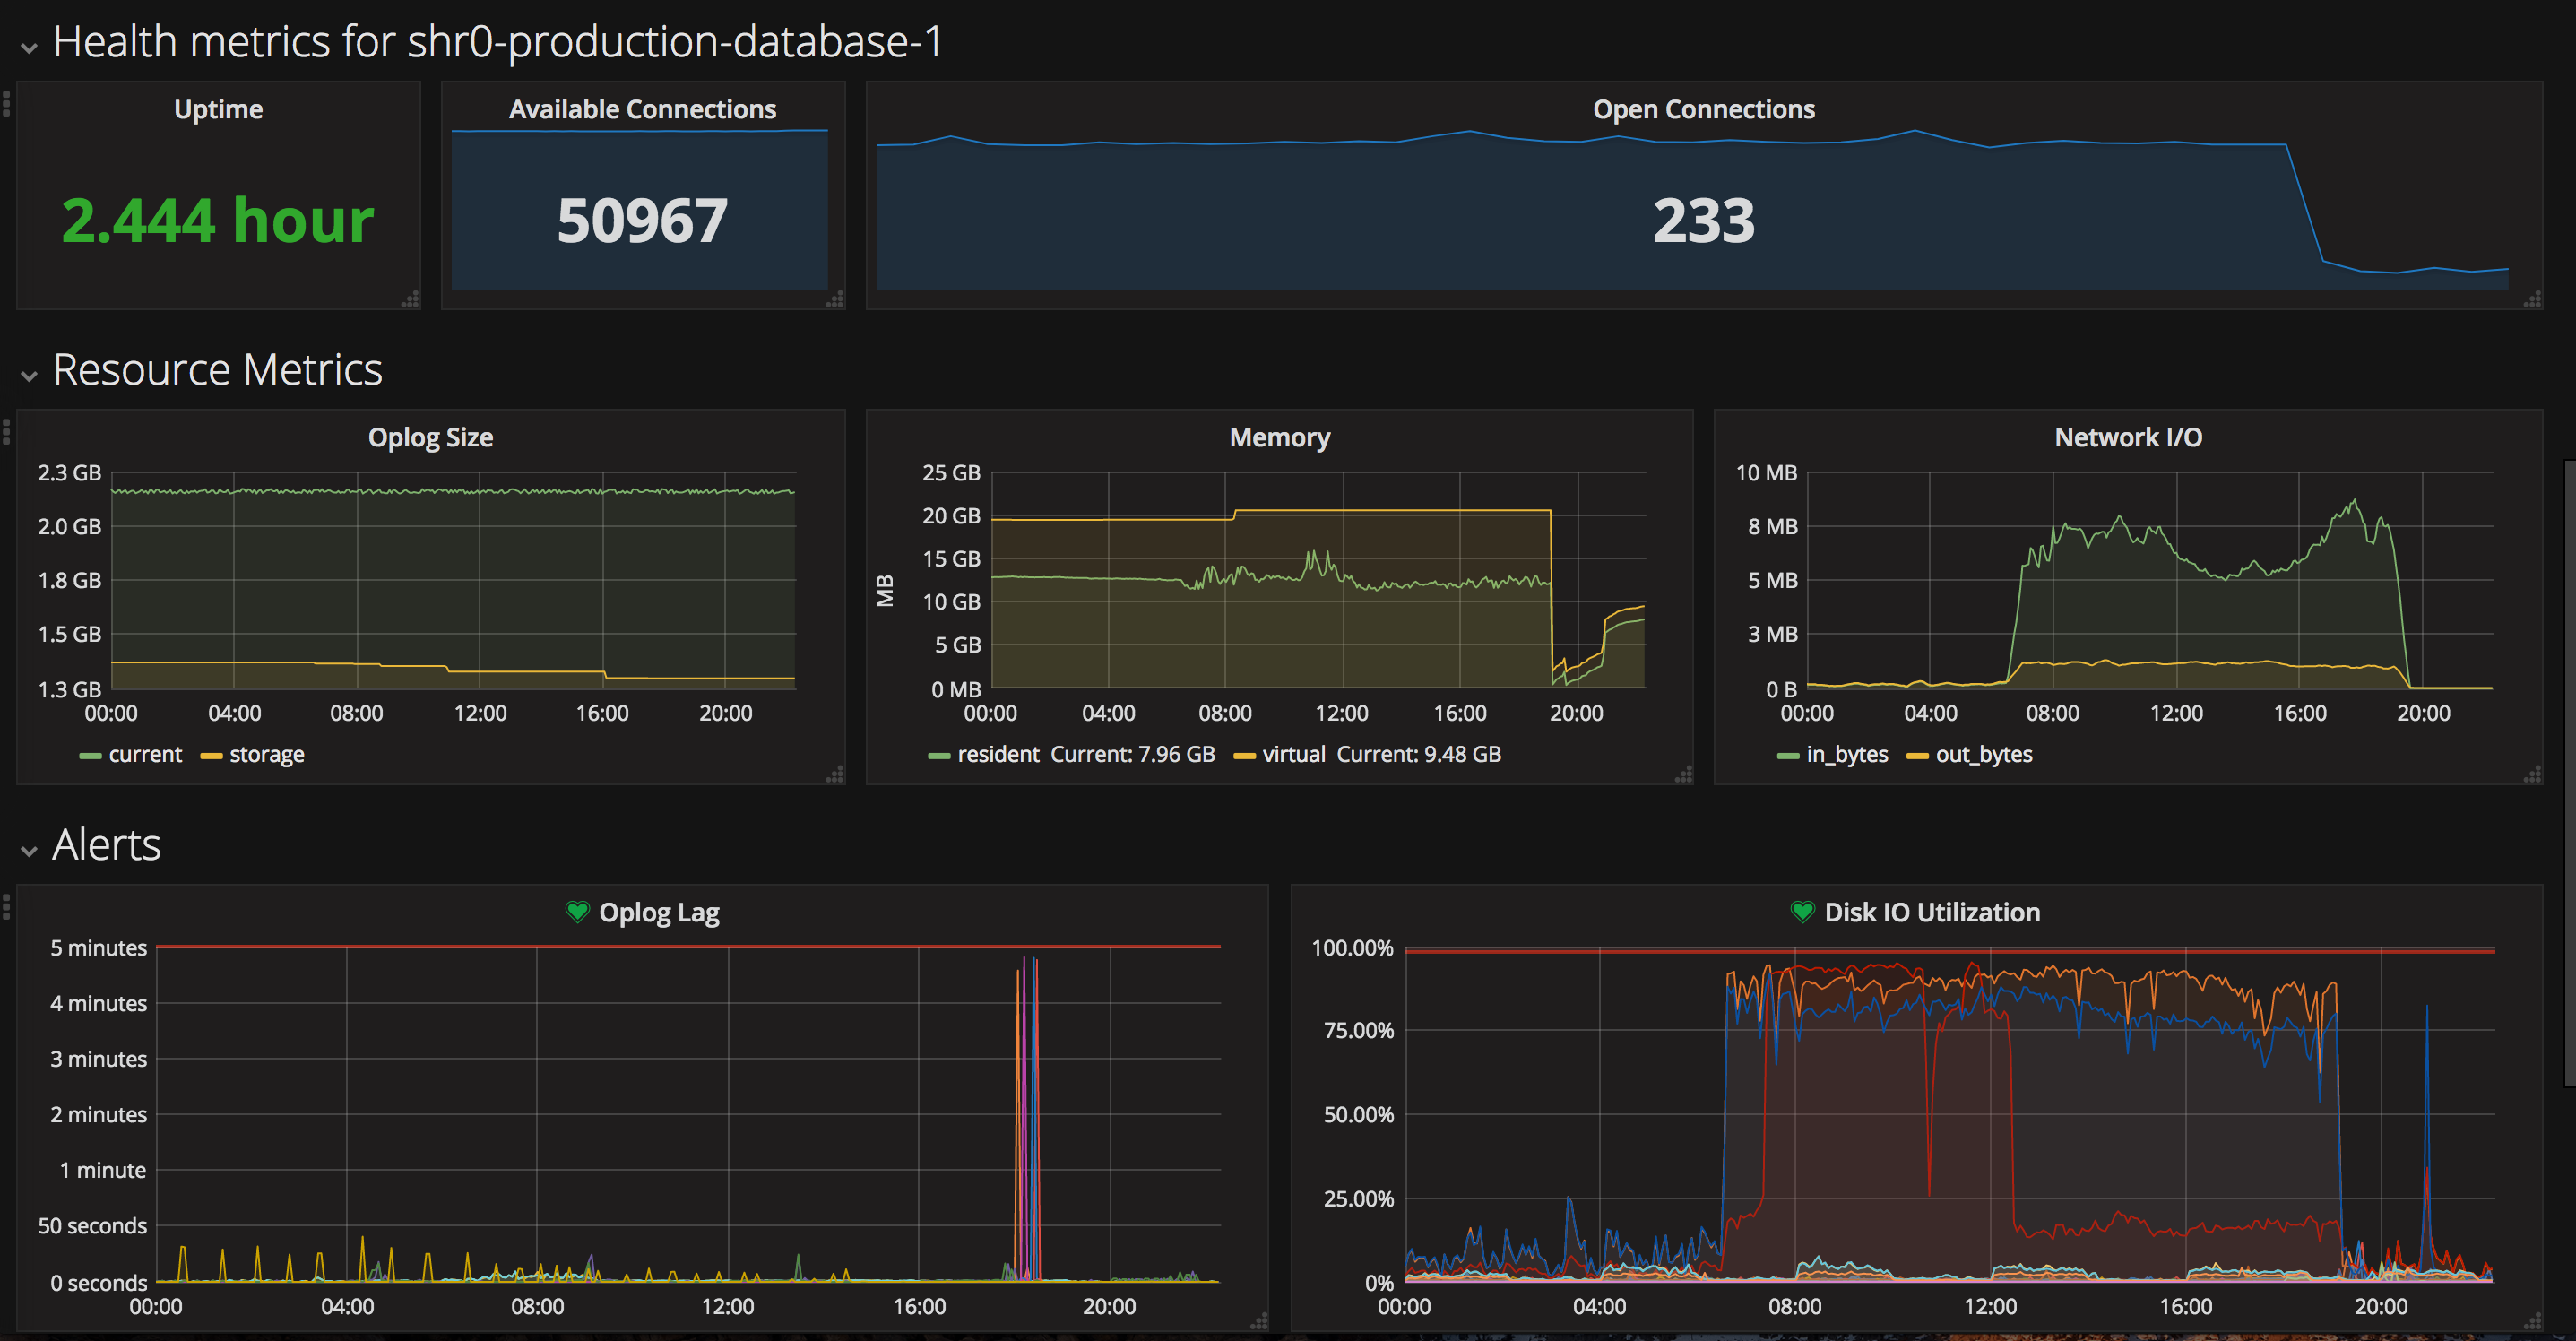
Monitors MongoDB performance and health by aggregating key metrics across nodes and replica sets to highlight latency, throughput, and replication status. A couple of core metrics are emphasized: New read/write request rates and replica lag, shown with mongod_requests_per_second and replica_set_primary_to_secondary_lag_seconds (illustrative names). The dashboard typically includes panels for query latency distributions, operation counts, and storage I/O, with alerting and time-range filtering to quickly identify bottlenecks and ensure high availability.
Screenshots
Get Dashboard✕
Download
Copy to Clipboard