MongoDB 92,54292,542 5.0 (2 reviews)
Description
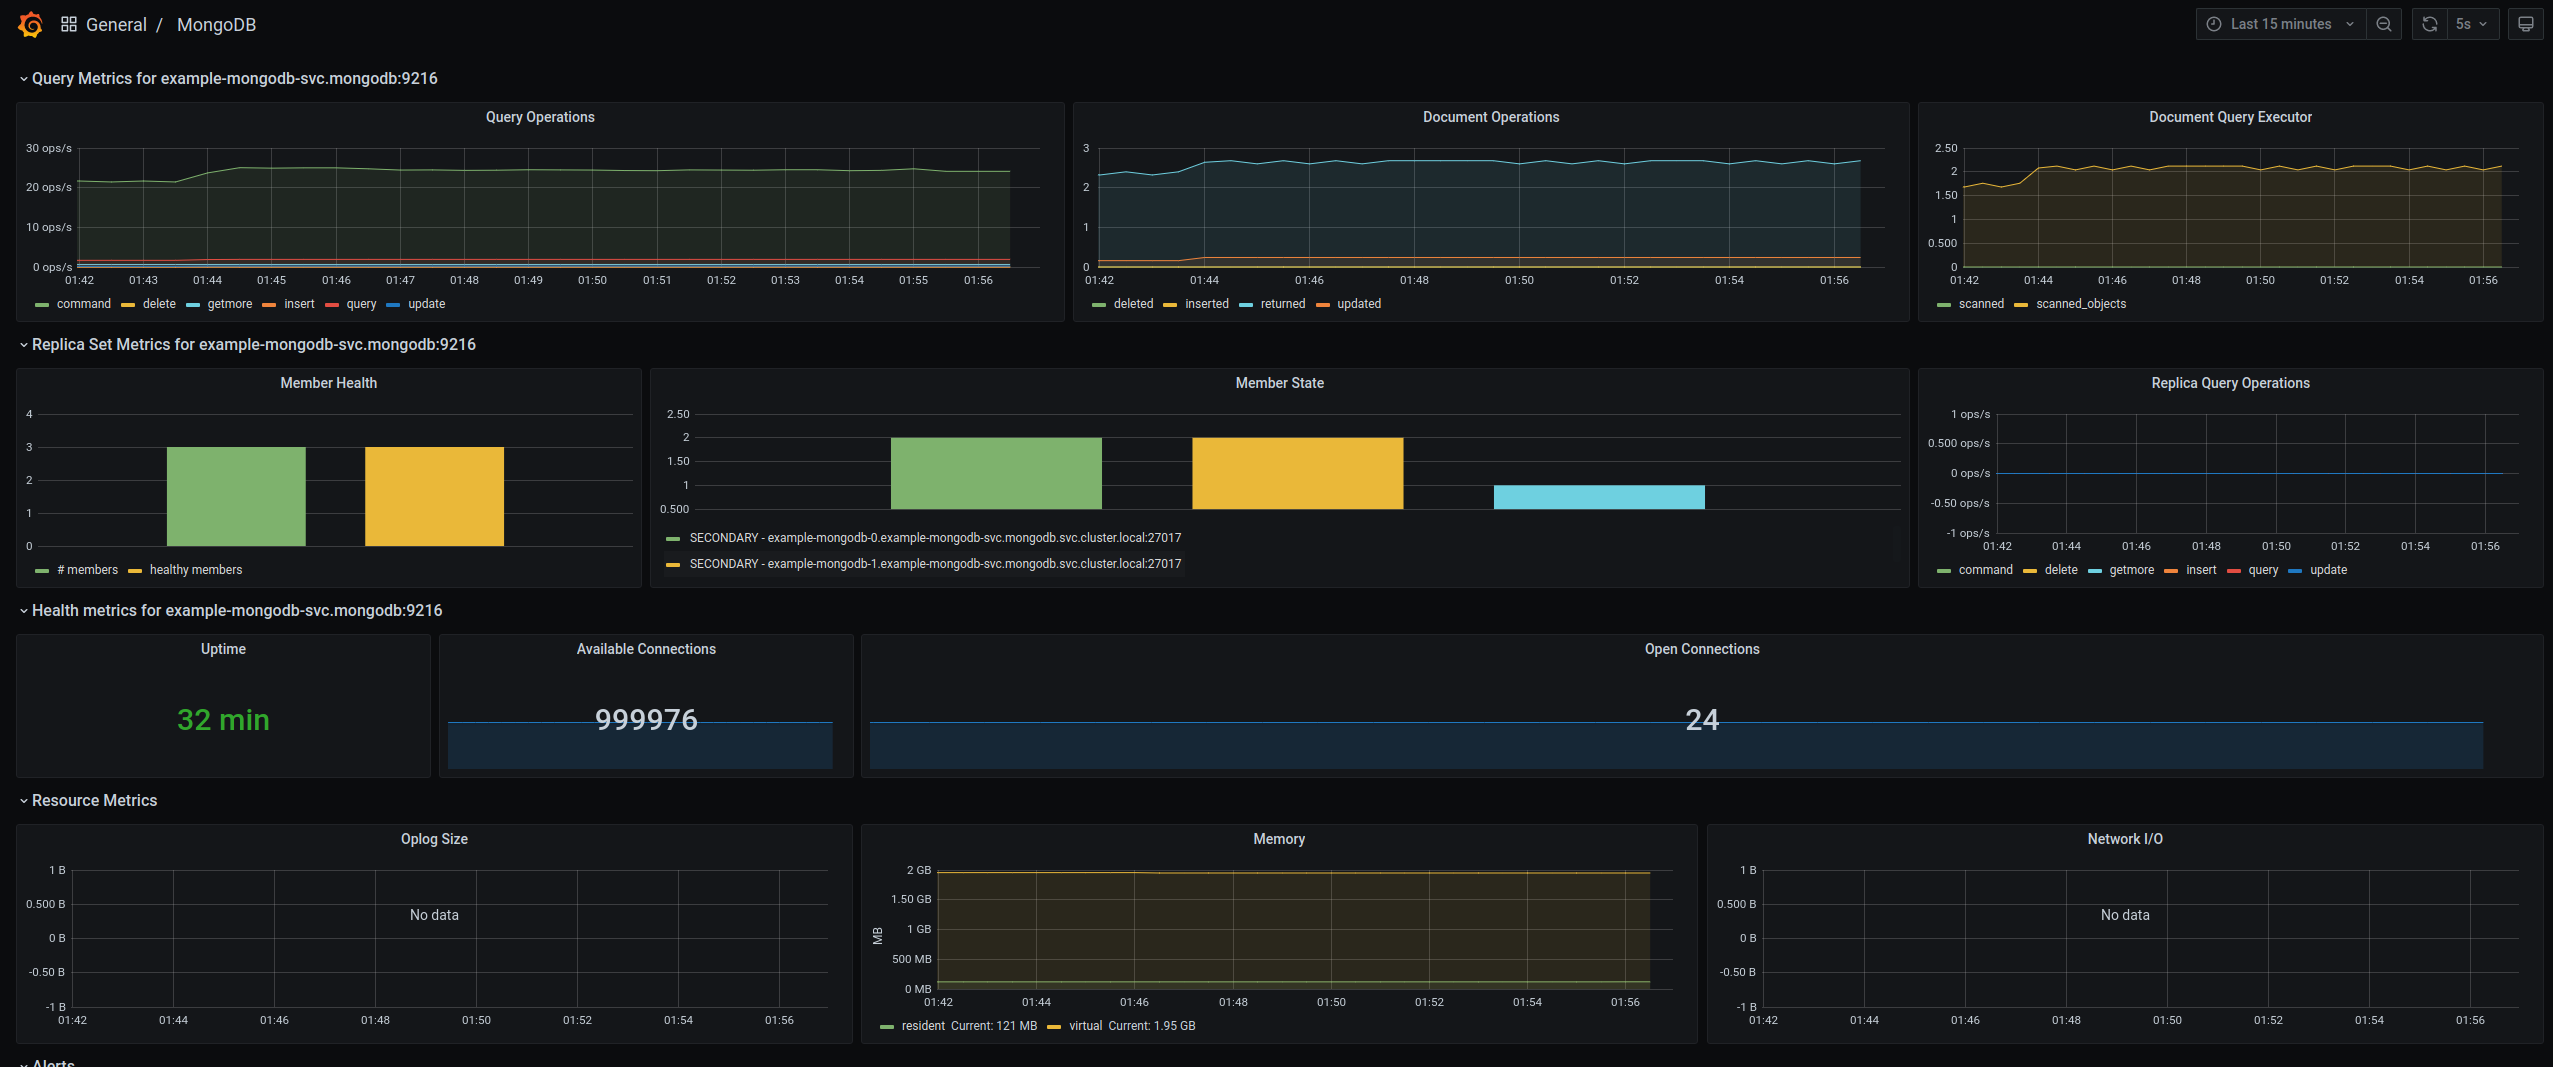
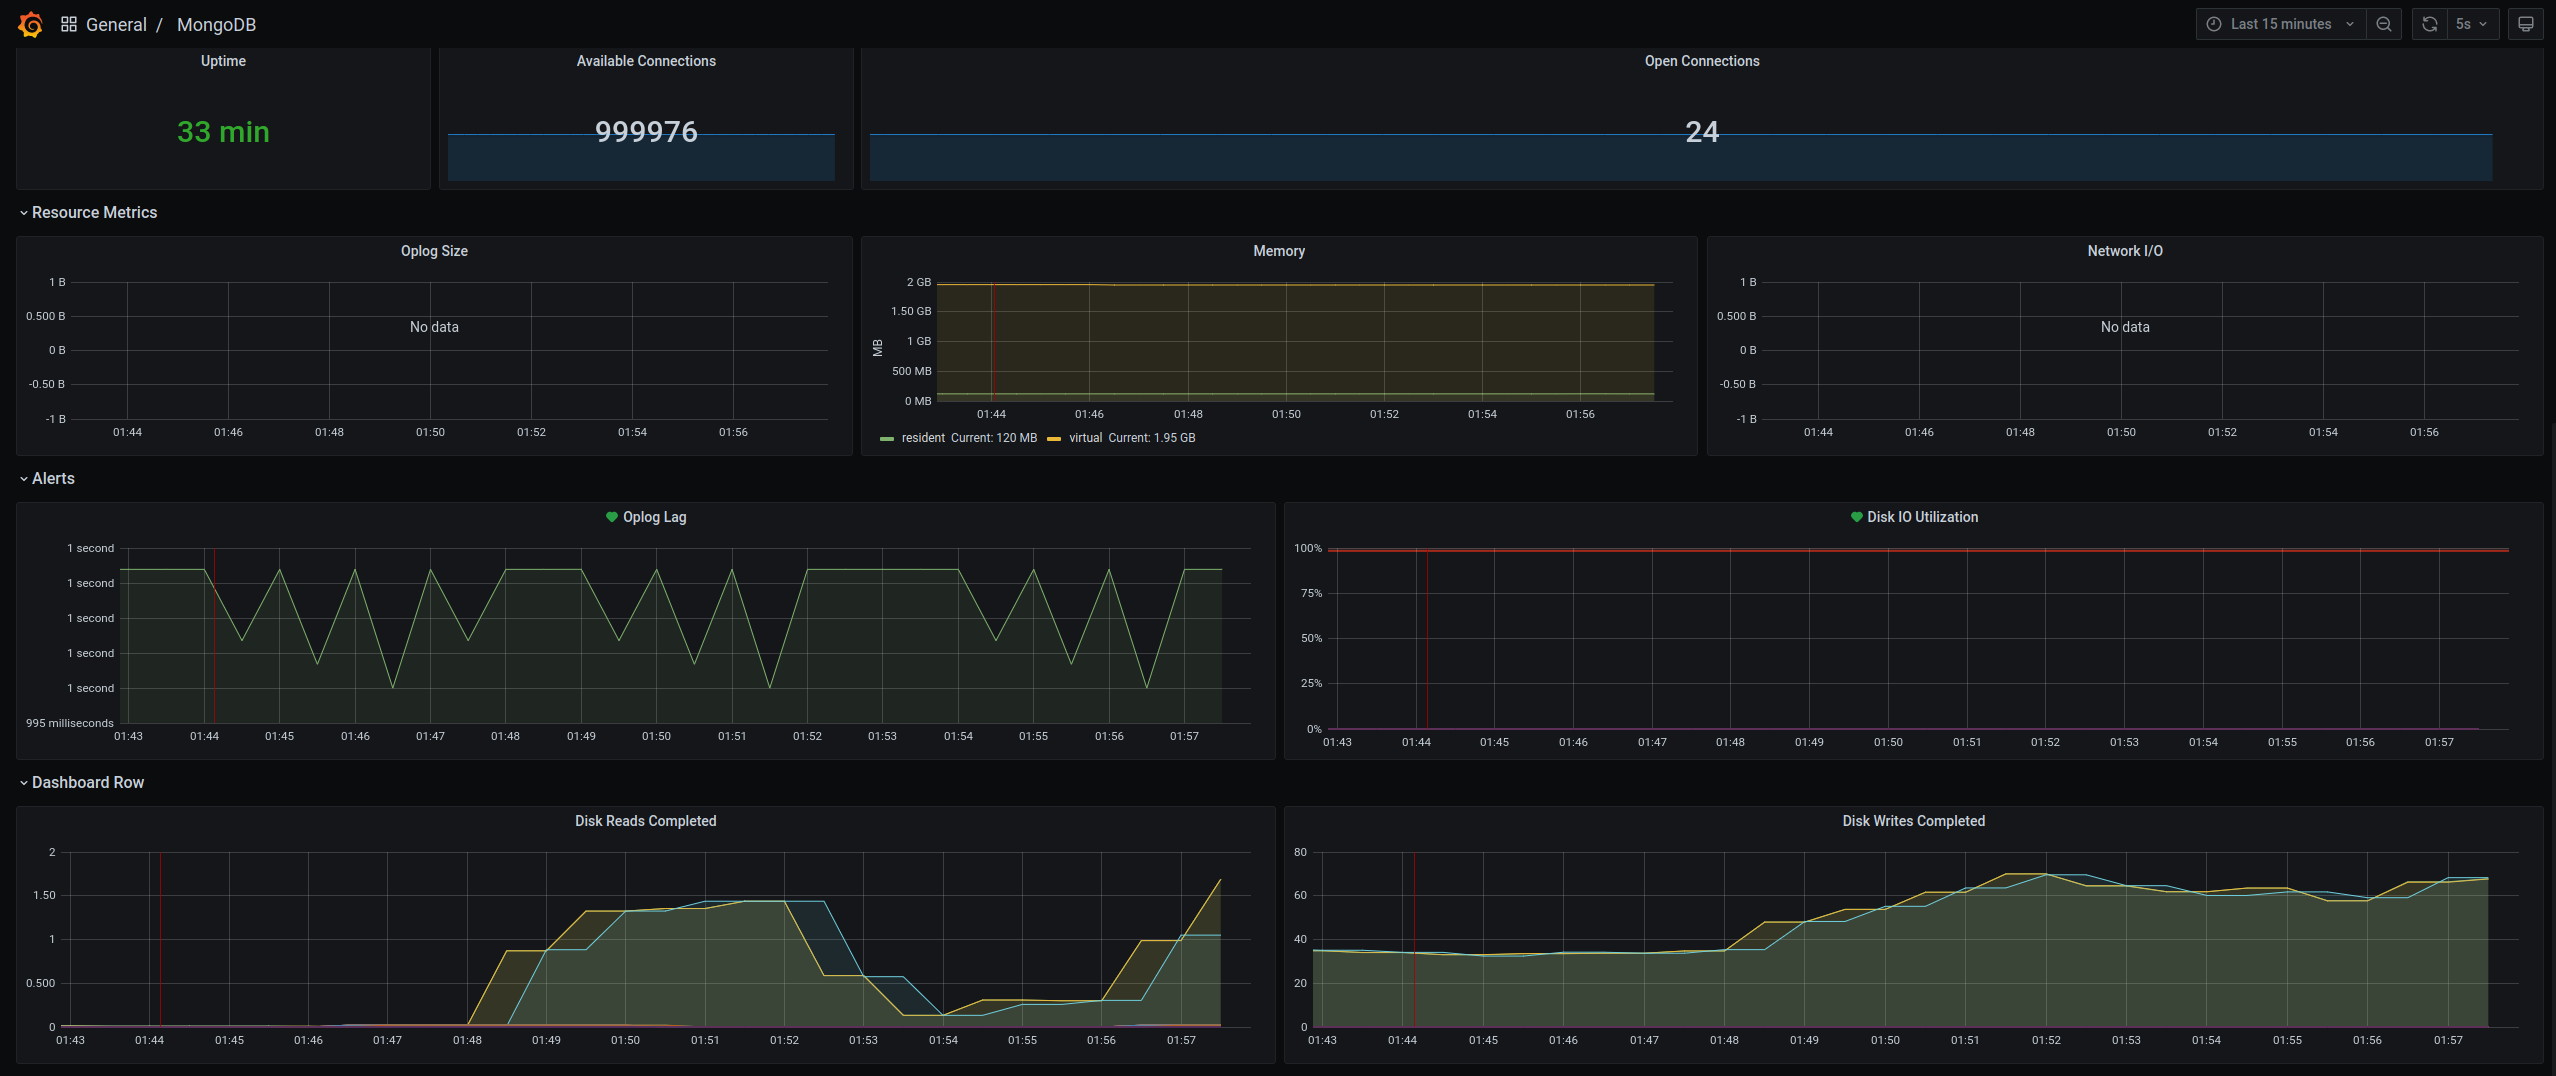
This dashboard provides a comprehensive, at-a-glance view of a MongoDB replica set’s health and performance, combining operational counters, replication state, and resource utilization. Key metrics include high-level query and document operation counts (mongodb_op_counters_total, mongodb_mongod_metrics_document_total, mongodb_mongod_metrics_query_executor_total), replica set membership and state (mongodb_mongod_replset_number_of_members, mongodb_rs_members_state), and resource usage such as uptime, connections, memory, and I/O (mongodb_instance_uptime_seconds, mongodb_connections, mongodb_memory). It also highlights critical latency and lag indicators like Oplog Lag and Disk I/O Utilization, enabling proactive performance troubleshooting.
Screenshots
Used Metrics 1515
interval
mongodb_connections
mongodb_instance_uptime_seconds
mongodb_memory
mongodb_mongod_metrics_document_total
mongodb_mongod_metrics_query_executor_total
mongodb_mongod_replset_number_of_members
mongodb_mongod_replset_oplog_head_timestamp
mongodb_network_metrics_num_requests_total
mongodb_op_counters_total
mongodb_oplog_stats_size
mongodb_rs_members_state
-
node_disk_io_time_seconds_total
-
node_disk_reads_completed_total
-
node_disk_writes_completed_total