MongoDB 16,228,62916,228,629 3.7 (3 reviews)
Description
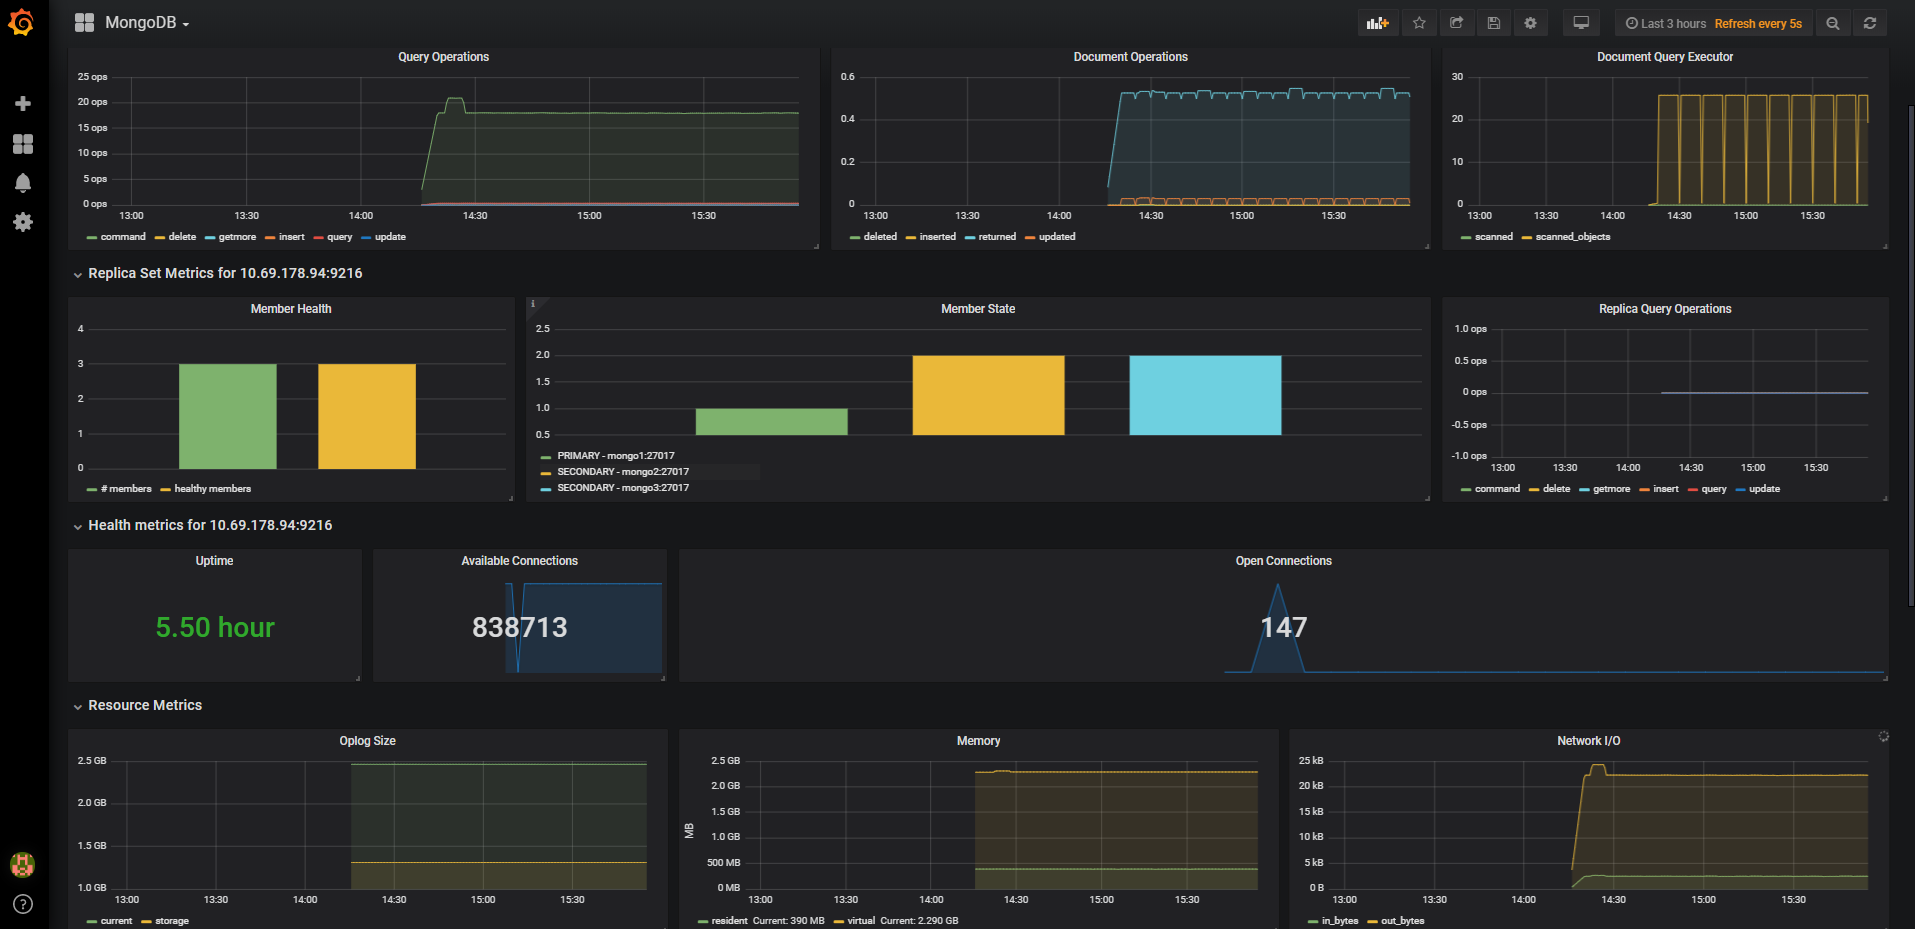
This dashboard monitors MongoDB performance and health, pulling in key operational, replication, and resource metrics to provide a holistic view of a cluster. It highlights query and document operation throughput, replica set state, and system resources, enabling quick identification of bottlenecks and health issues. Notable metrics include mongodb_op_counters_total (operation throughput), mongodb_mongod_metrics_document_total and mongodb_mongod_metrics_query_executor_total (document load/query efficiency), and mongodb_mongod_replset_member_state (replica set health and member status) while also tracking uptime, connections, and Oplog activity for stability assessment.
Screenshots
Used Metrics 1616
interval
mongodb_connections
mongodb_instance_uptime_seconds
mongodb_memory
mongodb_mongod_metrics_document_total
mongodb_mongod_metrics_query_executor_total
mongodb_mongod_replset_member_state
mongodb_mongod_replset_number_of_members
mongodb_mongod_replset_oplog_head_timestamp
mongodb_mongod_replset_oplog_size_bytes
mongodb_network_bytes_total
mongodb_op_counters_repl_total
mongodb_op_counters_total
-
node_disk_io_time_seconds_total
-
node_disk_reads_completed_total
-
node_disk_writes_completed_total