Mongo DB 1,8051,805
6/30/2020
6/3/2022
1
Databases
>=7.0.1
Description
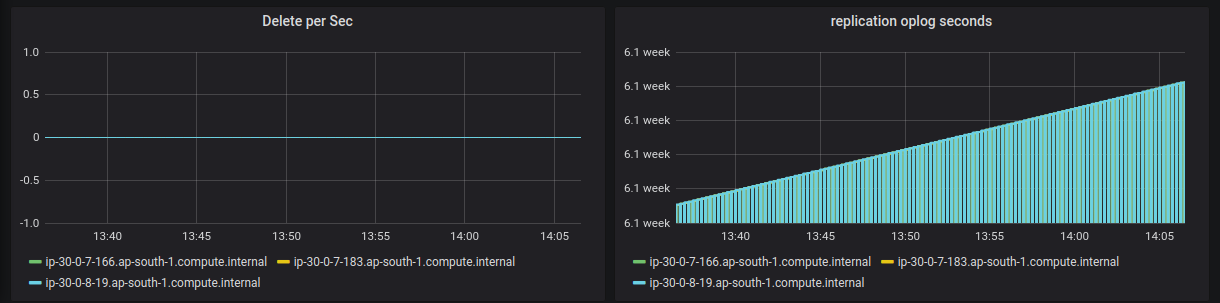
A Mongodb Replication Performance Monitoring with Prometheus and telegraf agent
Screenshots
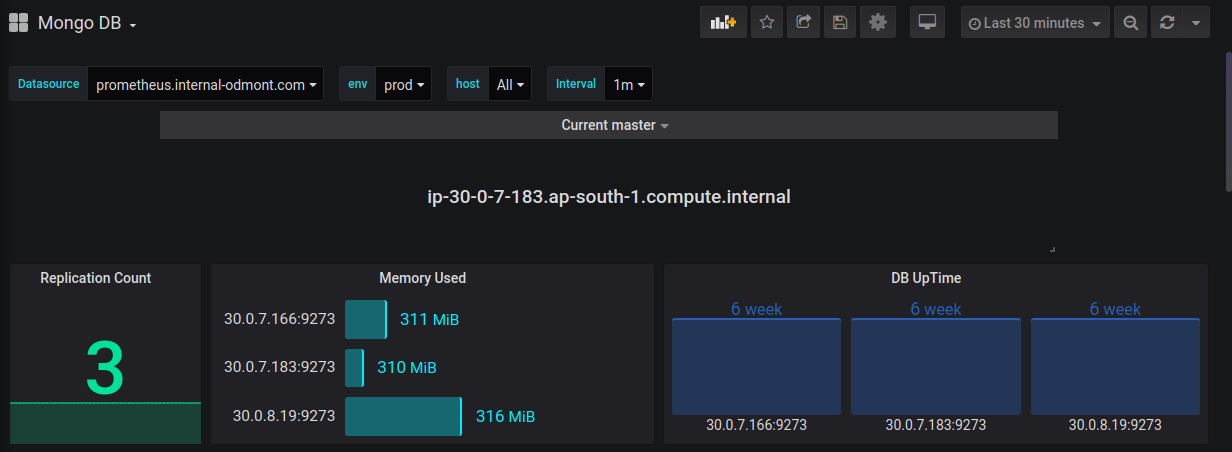
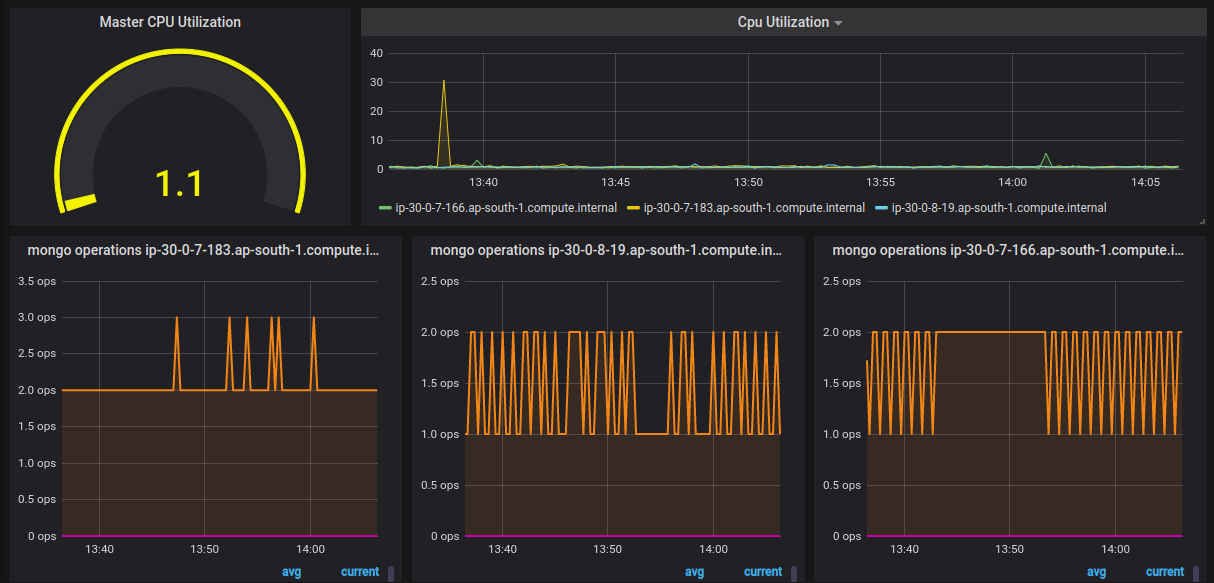
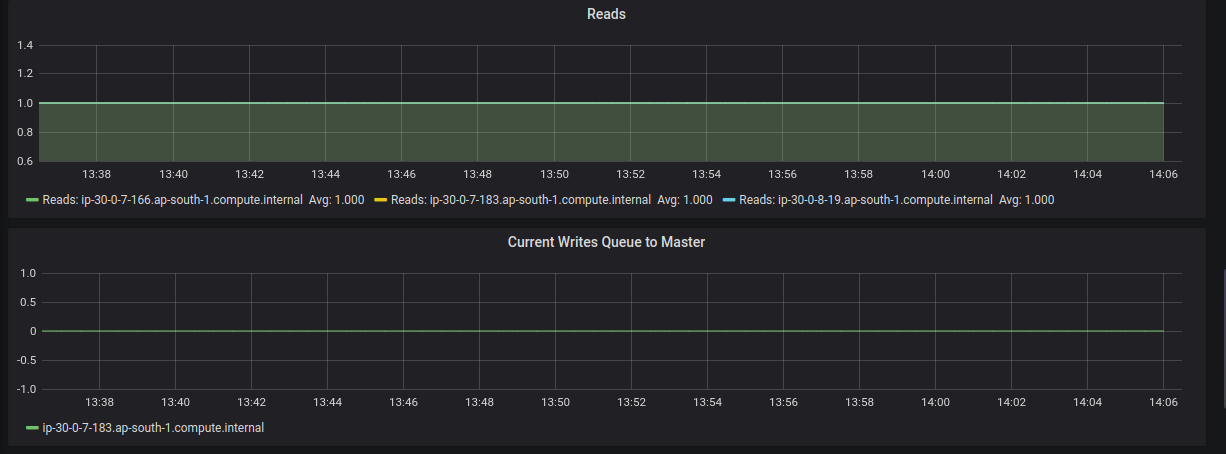
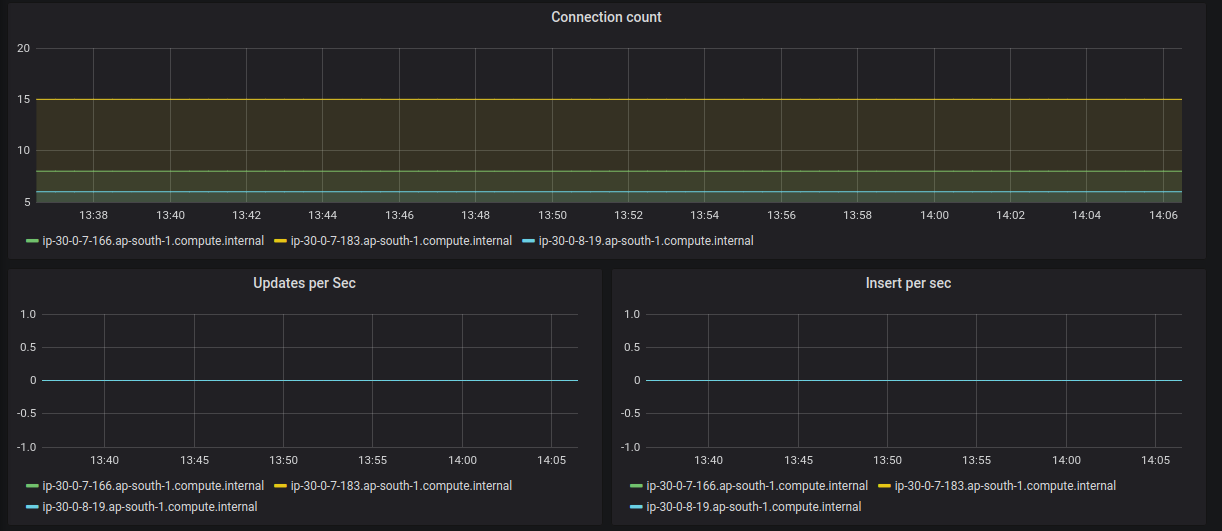
Used Metrics 1717
cpu_usage_idle
mem_used
mongodb_active_reads
mongodb_active_writes
mongodb_commands_per_sec
mongodb_deletes
mongodb_deletes_per_sec
mongodb_flushes_per_sec
mongodb_getmores_per_sec
mongodb_inserts
mongodb_inserts_per_sec
mongodb_open_connections
mongodb_queries_per_sec
mongodb_repl_oplog_window_sec
mongodb_updates
mongodb_updates_per_sec
mongodb_uptime_ns
Get Dashboard✕
Download
Copy to Clipboard