Mikrotik snmp 1,6661,666
1/1/2022
1/1/2022
1
Host Metrics
>=8.1.2
Prometheus
Description
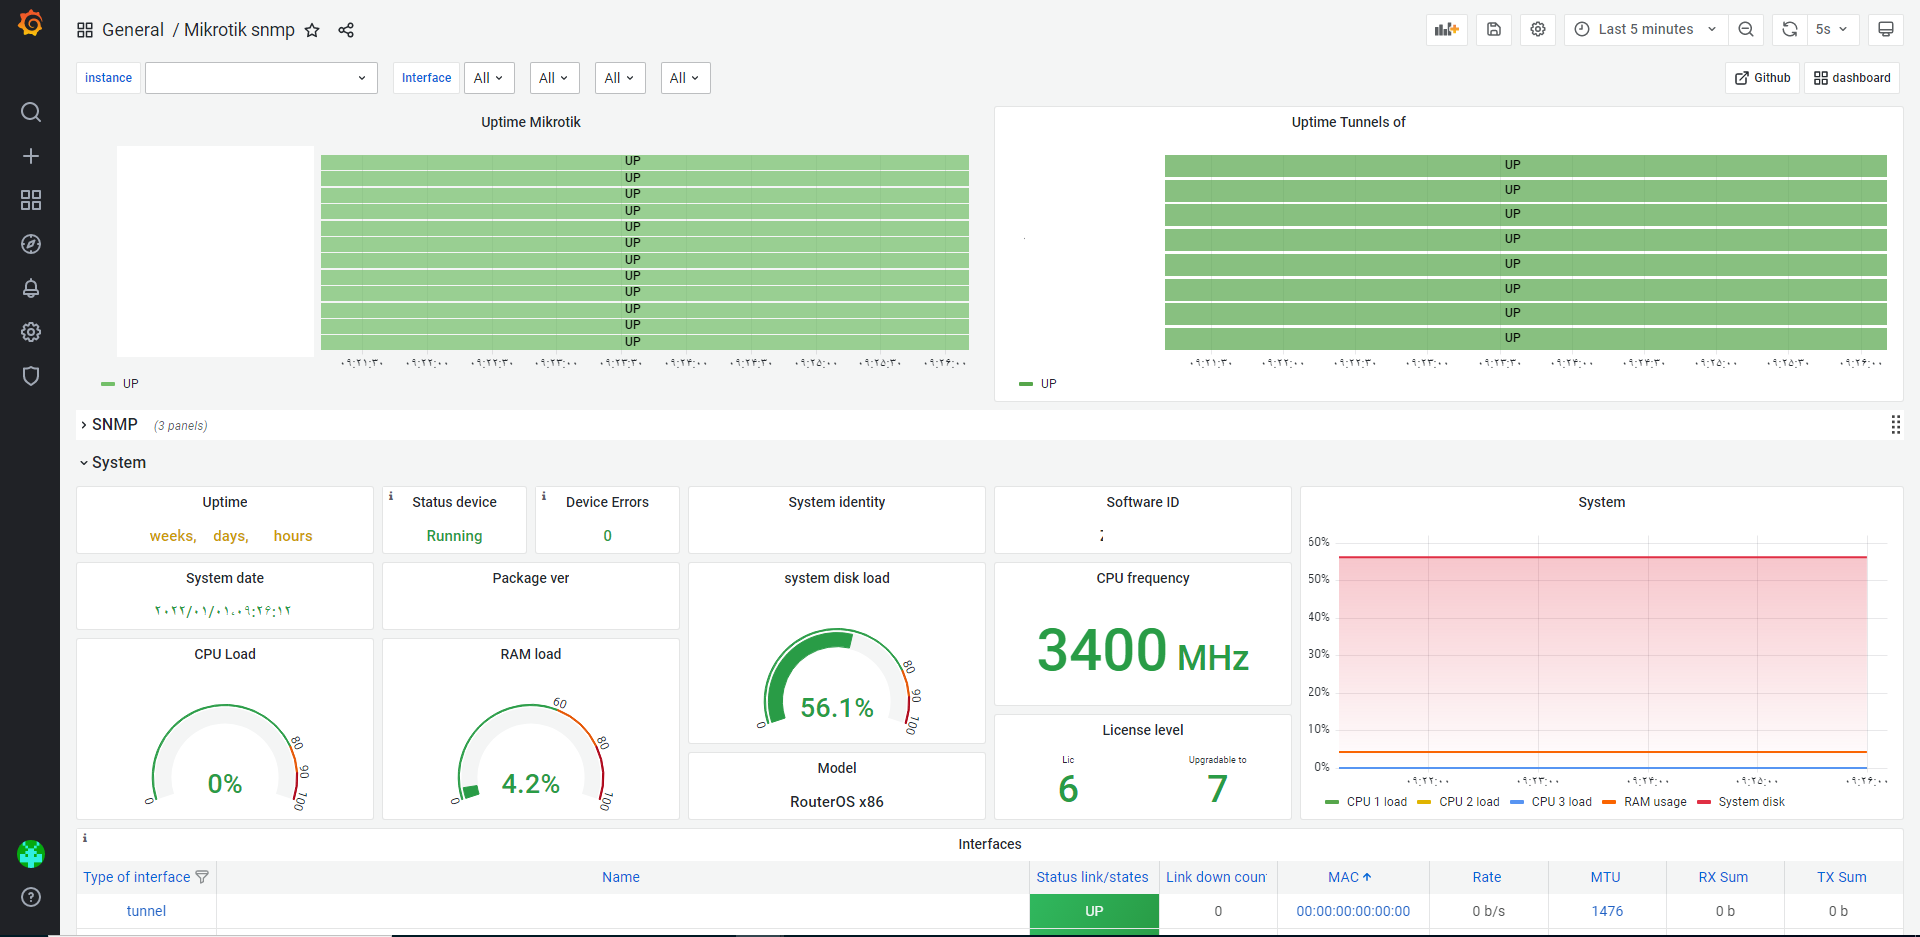
Mikrotik monitoring (8.2.1) Edited By Soroush Kaviani
Screenshots
Used Metrics 2727
hrDeviceErrors
hrDeviceStatus
hrProcessorLoad
hrStorageSize
hrStorageUsed
hrSystemDate
ifAlias
ifMtu
ifOperStatus
ifPhysAddress
ifSpeed
ifType_info
mtxrHlProcessorFrequency
mtxrHlTemperature
mtxrHlVoltage
mtxrInterfaceStatsLinkDowns
mtxrInterfaceStatsRxBytes
mtxrInterfaceStatsTxBytes
mtxrLicLevel
mtxrLicSoftwareId
mtxrLicUpgradableTo
mtxrLicVersion
mtxrPOEInterfaceIndex
sysDescr
sysIdentity
sysUpTime
-
up
Get Dashboard✕
Download
Copy to Clipboard