Mikrotik 3,4323,432 5.0 (1 reviews)
8/10/2021
1/14/2024
5
DockerHost Metrics
>=10.2.2
Prometheus
Description
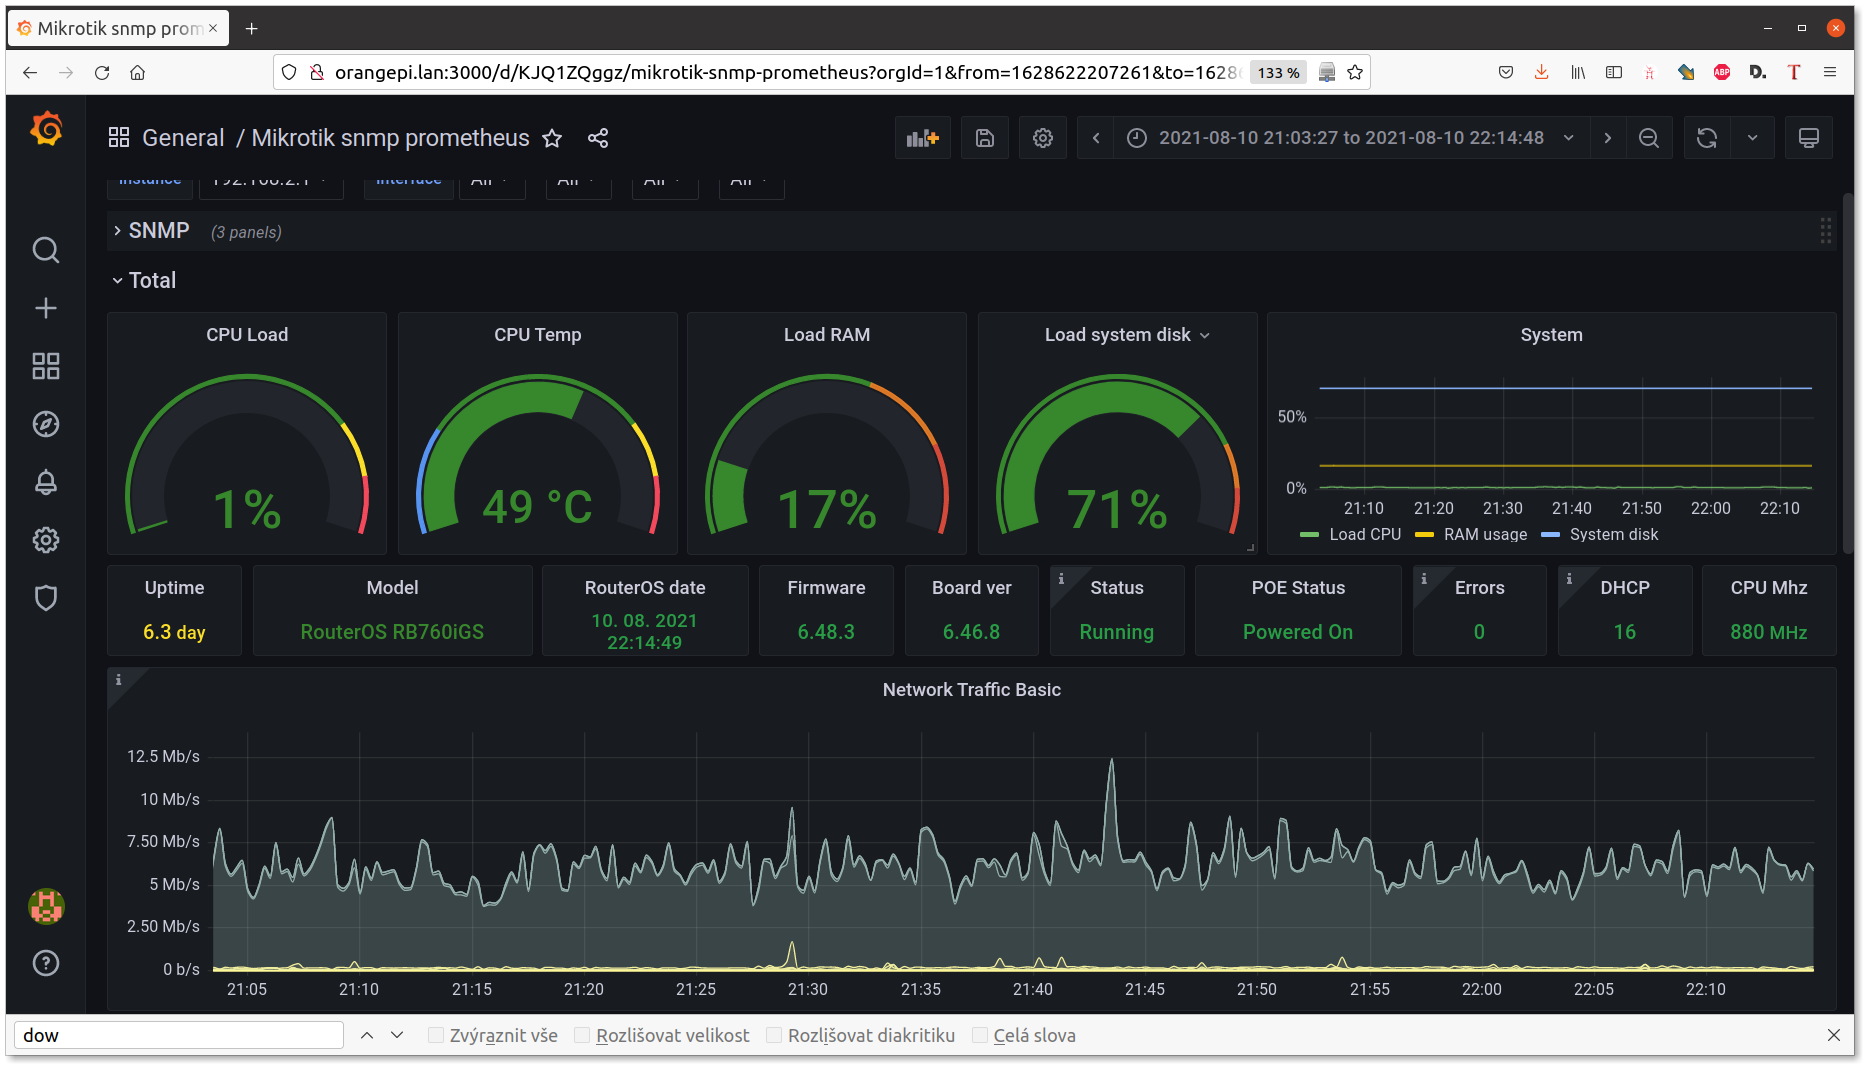
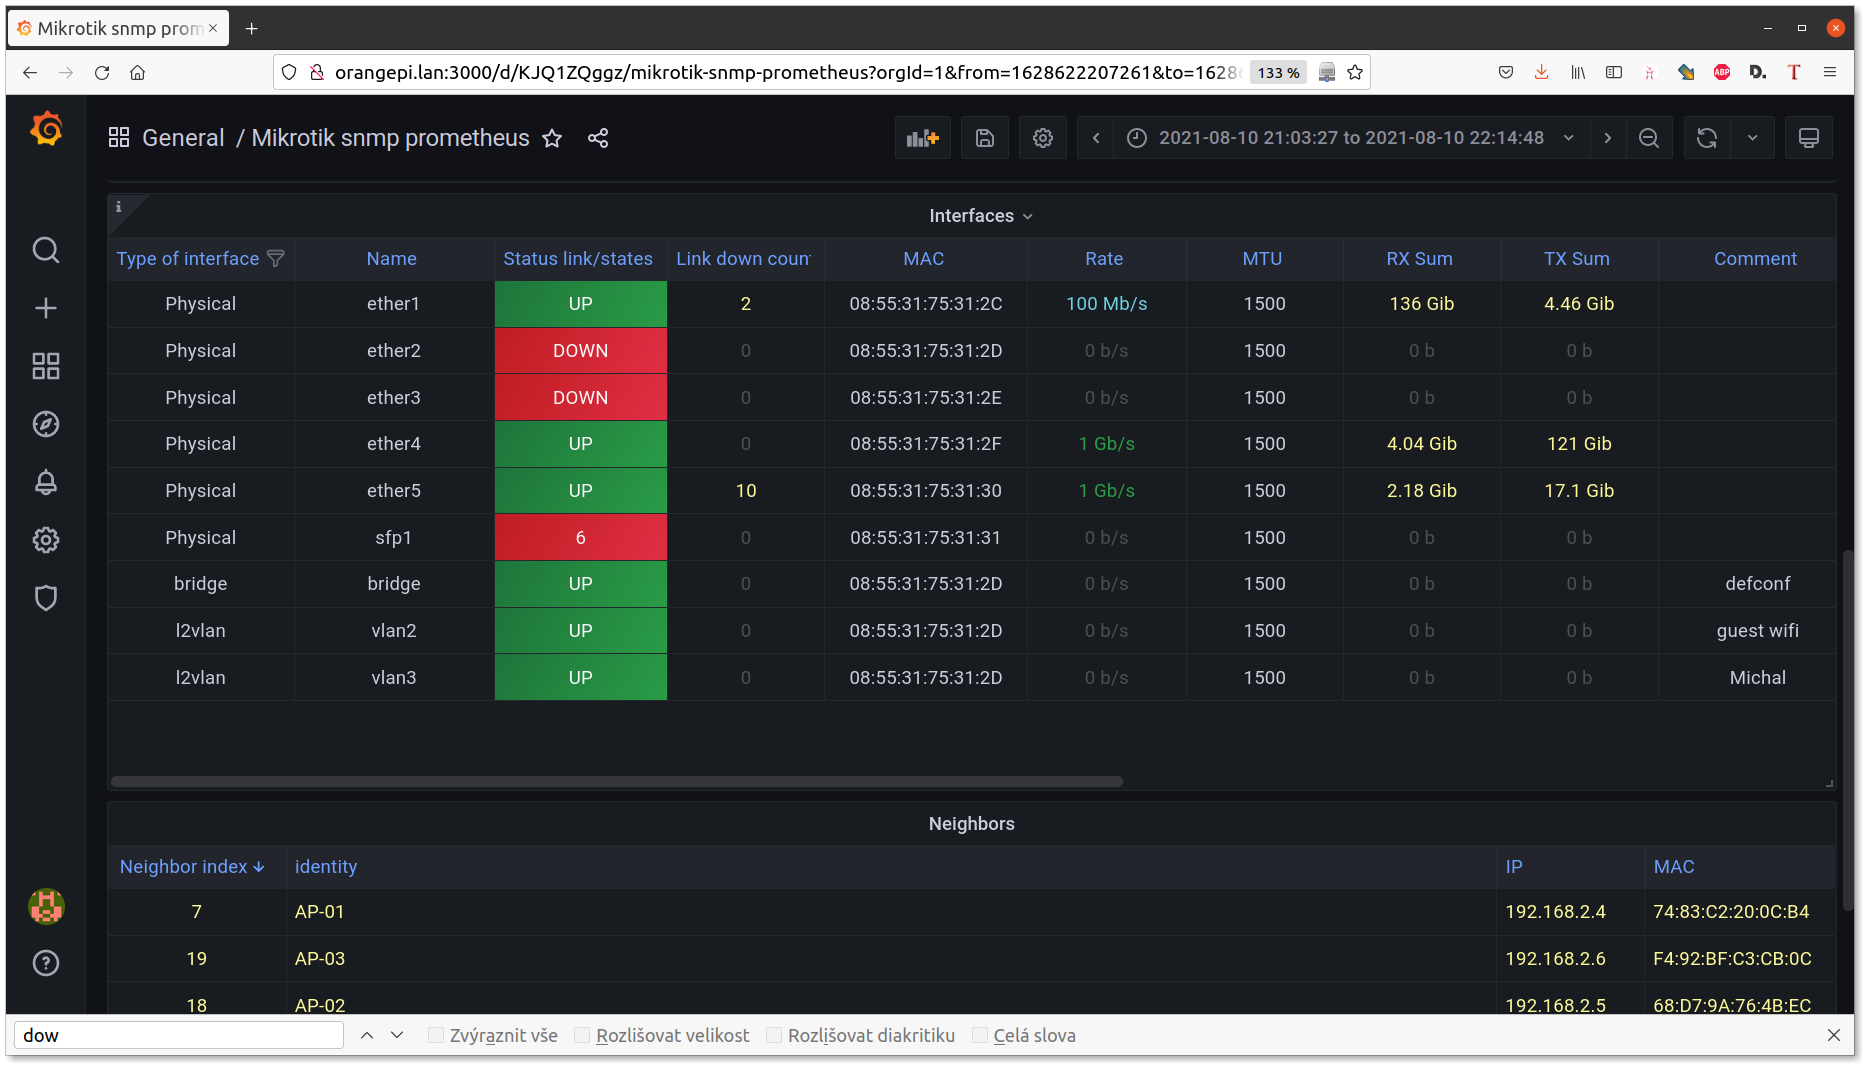
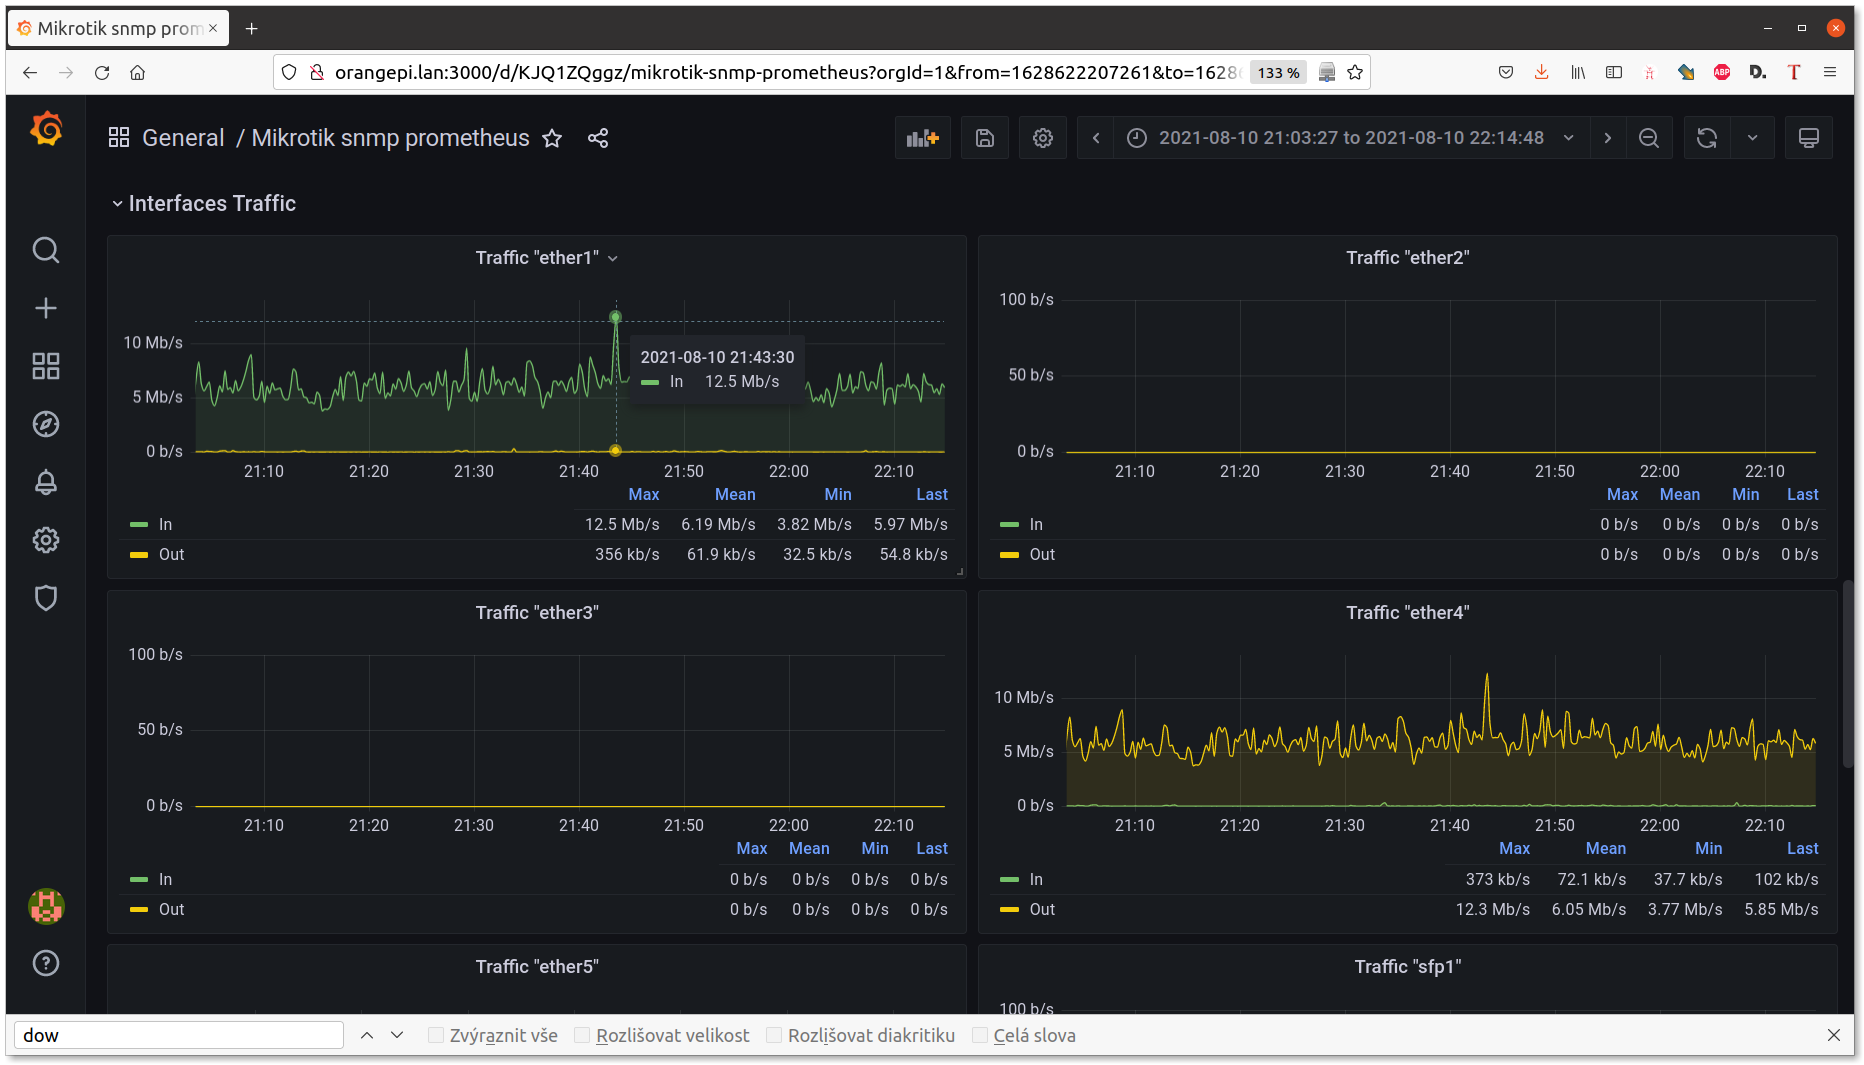
Mikrotik snmp monitoring (prometheus)
Screenshots
Used Metrics 3434
hrDeviceErrors
hrDeviceStatus
hrProcessorLoad
hrStorageSize
hrStorageUsed
hrSystemDate
hrSystemUptime
ifAlias
ifHCInOctets
ifHCOutOctets
ifMtu
ifOperStatus
ifPhysAddress
ifSpeed
ifType_info
mtxrDHCPLeaseCount
mtxrFirmwareVersion
mtxrHlProcessorFrequency
mtxrHlProcessorTemperature
mtxrHlTemperature
mtxrInterfaceStatsLinkDowns
mtxrInterfaceStatsRxBytes
mtxrInterfaceStatsTxBytes
mtxrLicVersion
mtxrNeighborIdentity
mtxrNeighborInterfaceID
mtxrNeighborIpAddress
mtxrNeighborMacAddress
mtxrNeighborPlatform
mtxrNeighborSoftwareID
mtxrNeighborVersion
mtxrPOEInterfaceIndex
mtxrPOEStatus
sysDescr
Get Dashboard✕
Download
Copy to Clipboard