Microsoft SQL Server 173,632173,632 5.0 (2 reviews)
Description
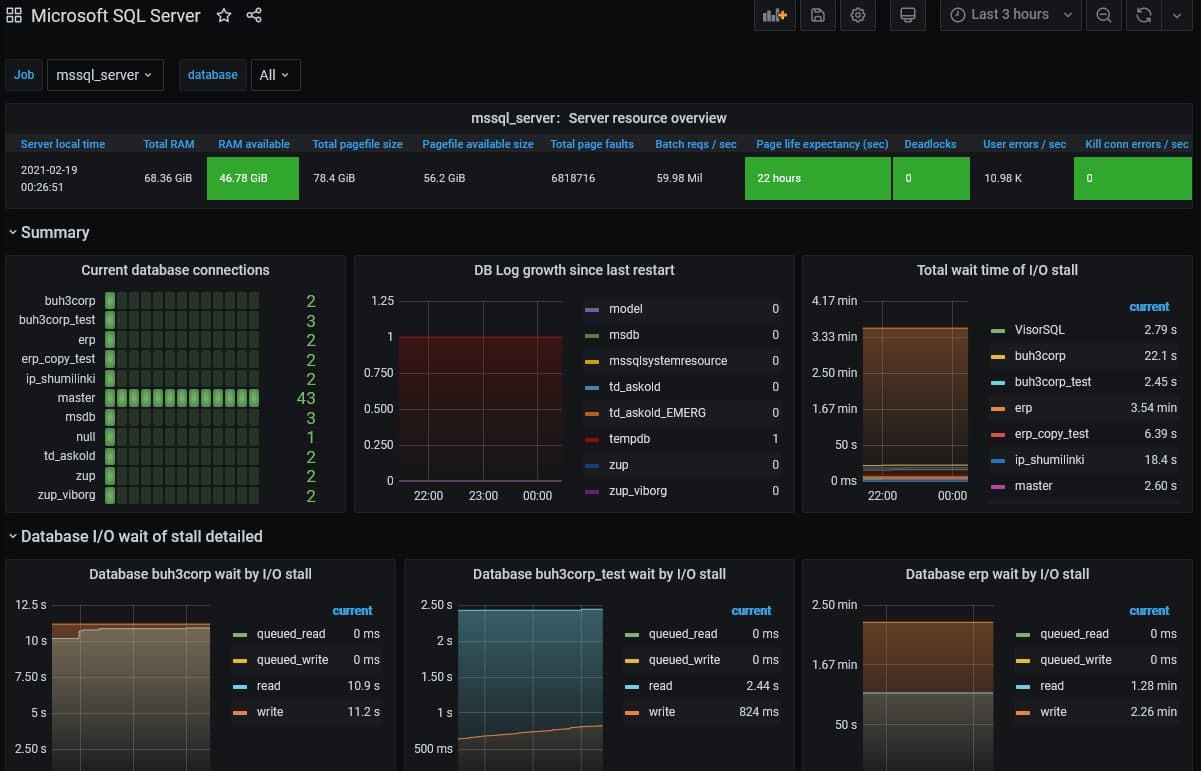
This dashboard monitors Microsoft SQL Server health and performance with a focus on resource utilization, activity, and waits. It highlights server resource overview through metrics like mssql_total_physical_memory_kb and mssql_available_physical_memory_kb, database activity via mssql_batch_requests and mssql_deadlocks, and I/O and wait statistics such as mssql_page_fault_count and wait-related dashboards like Database ${database} wait by I/O stall and mssql_total_page_file_kb.
Screenshots
Used Metrics 1616
mssql_available_page_file_kb
mssql_available_physical_memory_kb
mssql_batch_requests
mssql_connections
mssql_database_state
mssql_deadlocks
mssql_instance_local_time
mssql_io_stall
mssql_io_stall_total
mssql_kill_connection_errors
mssql_log_growths
mssql_page_fault_count
mssql_page_life_expectancy
mssql_total_page_file_kb
mssql_total_physical_memory_kb
mssql_user_errors