MicroProfile WildFly 16 Metrics 88,99688,996
Description
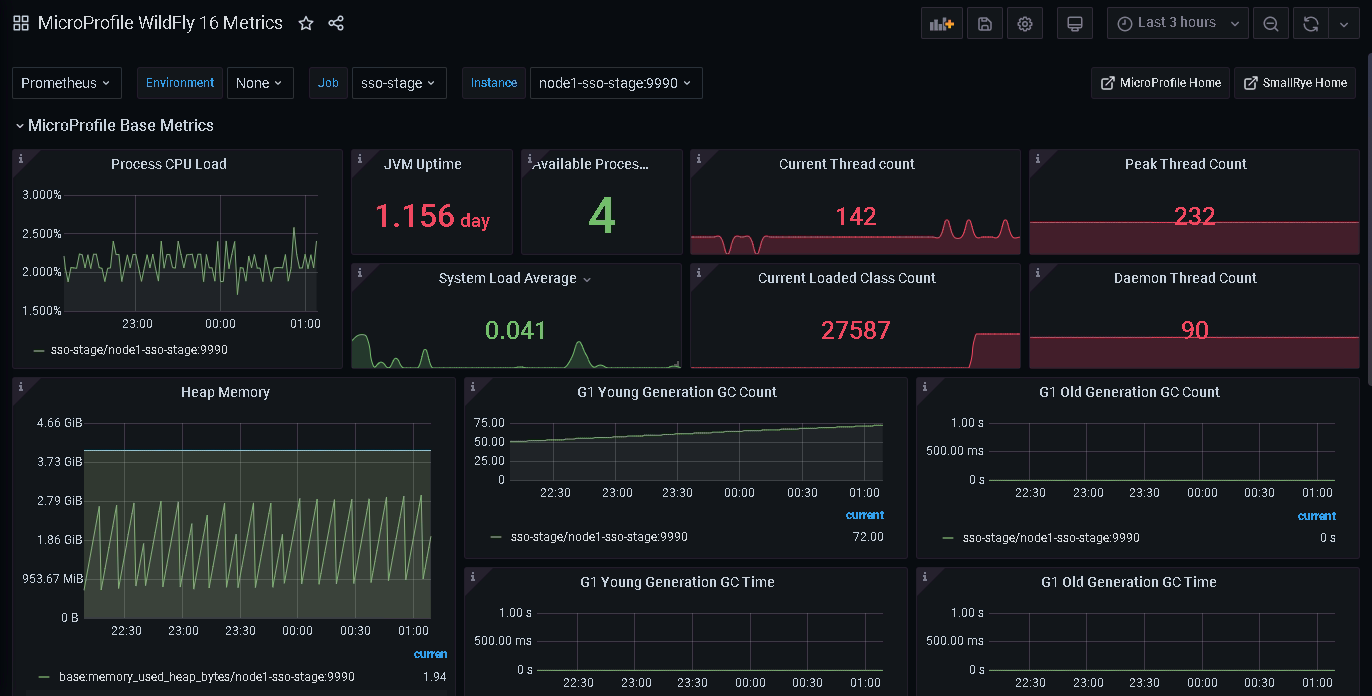
This dashboard monitors JVM and system-level performance for a MicroProfile WildFly 16 environment, pulling from metrics such as base:cpu_process_cpu_load, base:jvm_uptime_seconds, and base:memory_used_heap_bytes to assess runtime health and resource usage. It highlights key metrics related to CPU, memory, and thread activity, including Process CPU Load, Heap Memory, and Current Thread count, and provides visibility into JVM behavior with counters like base:classloader_current_loaded_class_count and base:thread_daemon_count for quick capacity and stability checks.
Screenshots
Used Metrics 2020
base:classloader_current_loaded_class_count
base:classloader_total_loaded_class_count
base:classloader_total_unloaded_class_count
base:cpu_available_processors
base:cpu_process_cpu_load
base:cpu_system_load_average
base:gc_g1_old_generation_count
base:gc_g1_old_generation_time_seconds
base:gc_g1_young_generation_count
base:gc_g1_young_generation_time_seconds
base:jvm_uptime_seconds
base:memory_committed_heap_bytes
base:memory_committed_non_heap_bytes
base:memory_max_heap_bytes
base:memory_max_non_heap_bytes
base:memory_used_heap_bytes
base:memory_used_non_heap_bytes
base:thread_count
base:thread_daemon_count
base:thread_max_count