Metrics Overview Cloud 65,18065,180
Description
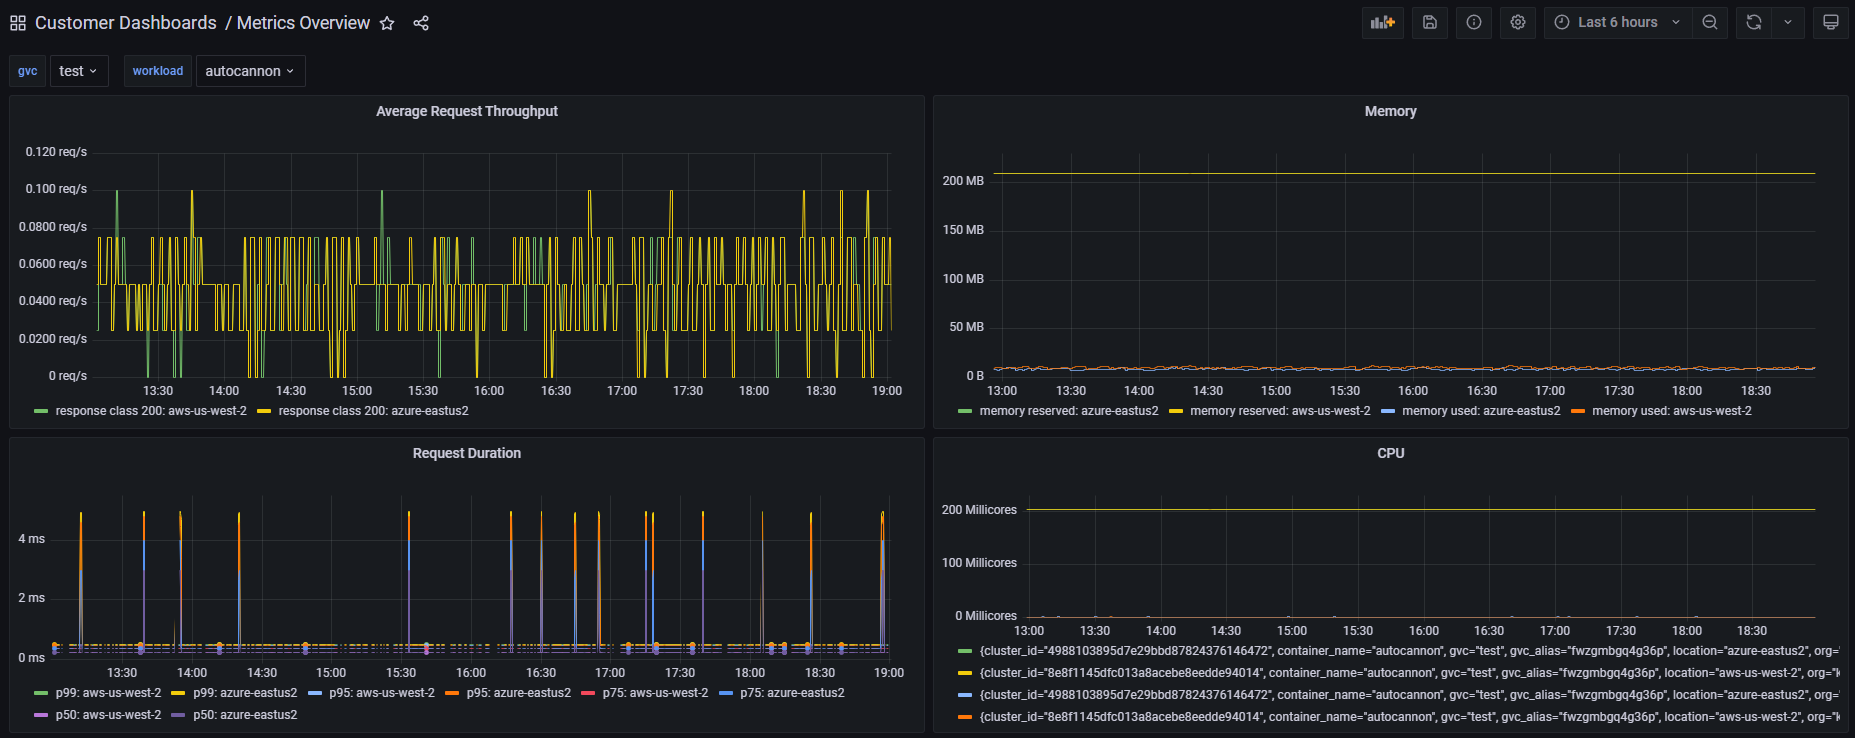
This dashboard provides a consolidated view of service performance and resource utilization, aggregating latency, error, throughput, and various resource metrics to surface operational health at a glance. It highlights latency distribution with percentile-based requests, error and throughput metrics like requests_per_second, and resource usage across CPU and memory (e.g., cpu_used, mem_used, cpu_reserved, mem_reserved) to identify bottlenecks and capacity needs. It also tracks deployment and infrastructure state with panels such as Progressing Deployments, Replica Count, and Egress, enabling quick detection of rollout issues and external connectivity concerns. Key features include percentile-based latency insights, conditional error categorization via response_class, and a mix of billed vs. used resource metrics for cost-aware scaling.
Screenshots
Used Metrics 2828
agent_peers_count
agent_rx_bytes_total
agent_services_count
agent_tx_bytes_total
container_restarts
cpu_billable
cpu_reserved
cpu_used
cron_executions
domain_warnings
egress
load_balancer
logs_storage_mb
mem_billable
mem_reserved
mem_used
percentile
replica_count
request_duration_ms_bucket
requests_per_second
response_class
threat_detection_alerts
threat_detection_forward_total
tracing_storage_mb
volume_set_capacity_billable
workload_progress_failure
workload_ready_replicas
workload_rescheduled_replicas