Memory Overview (Designed for PMM) 2,1052,105
1/18/2019
1/22/2019
3
Host Metrics
>=5.4.2
Prometheus
Description
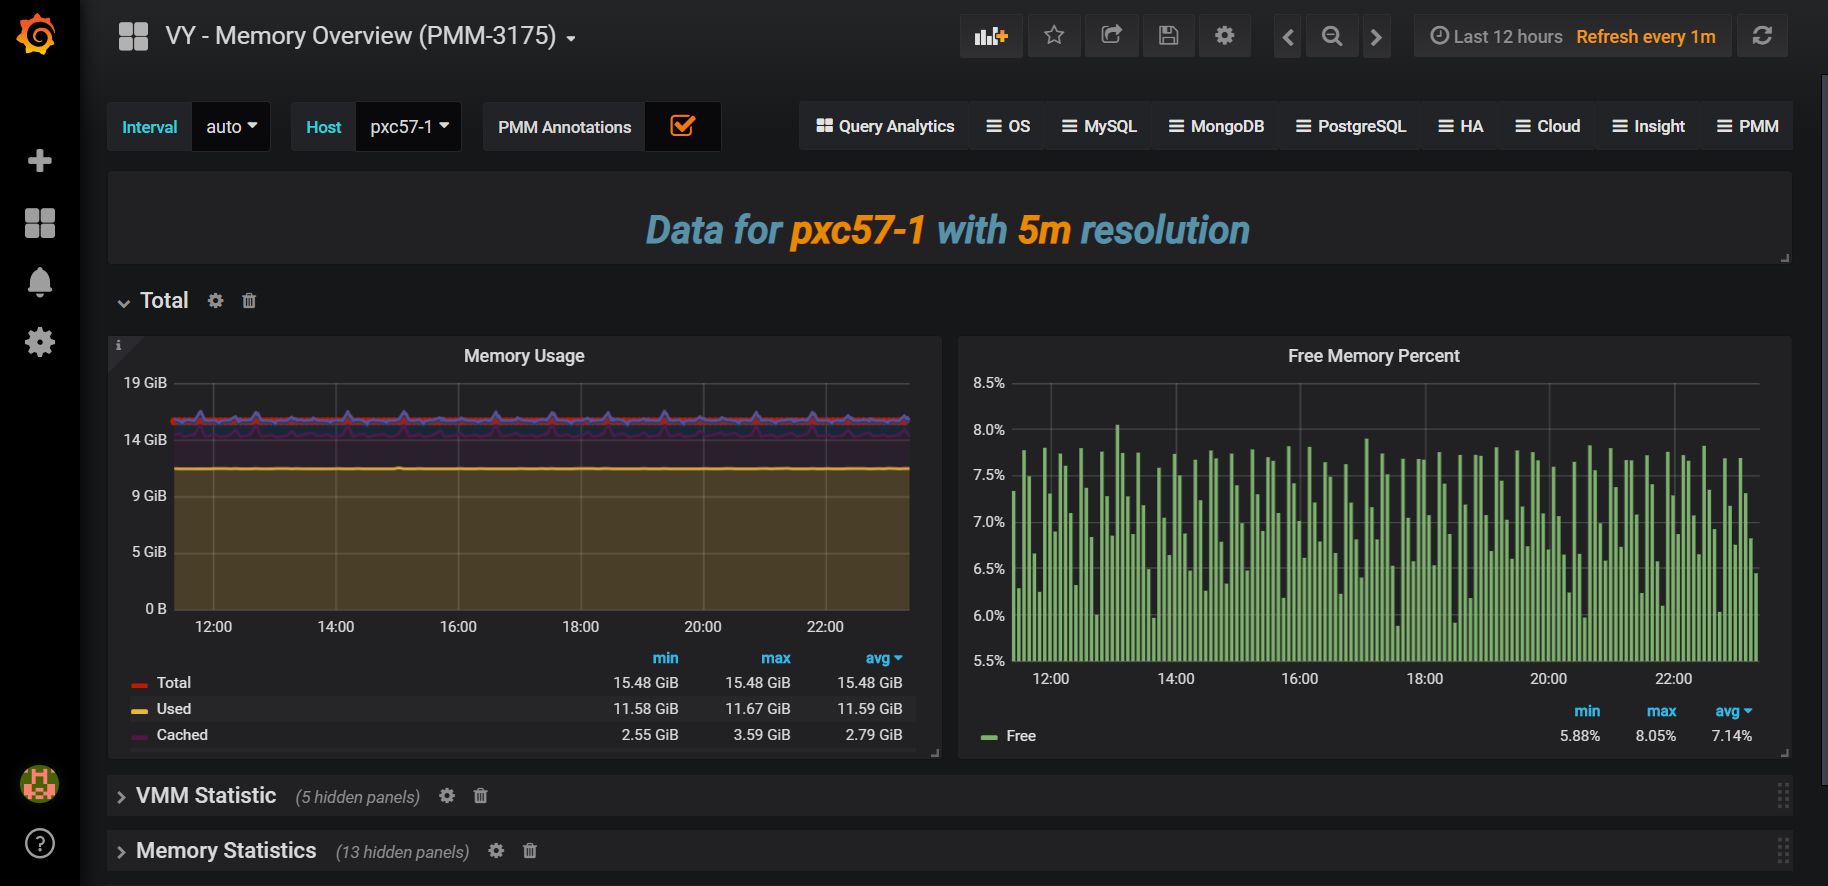
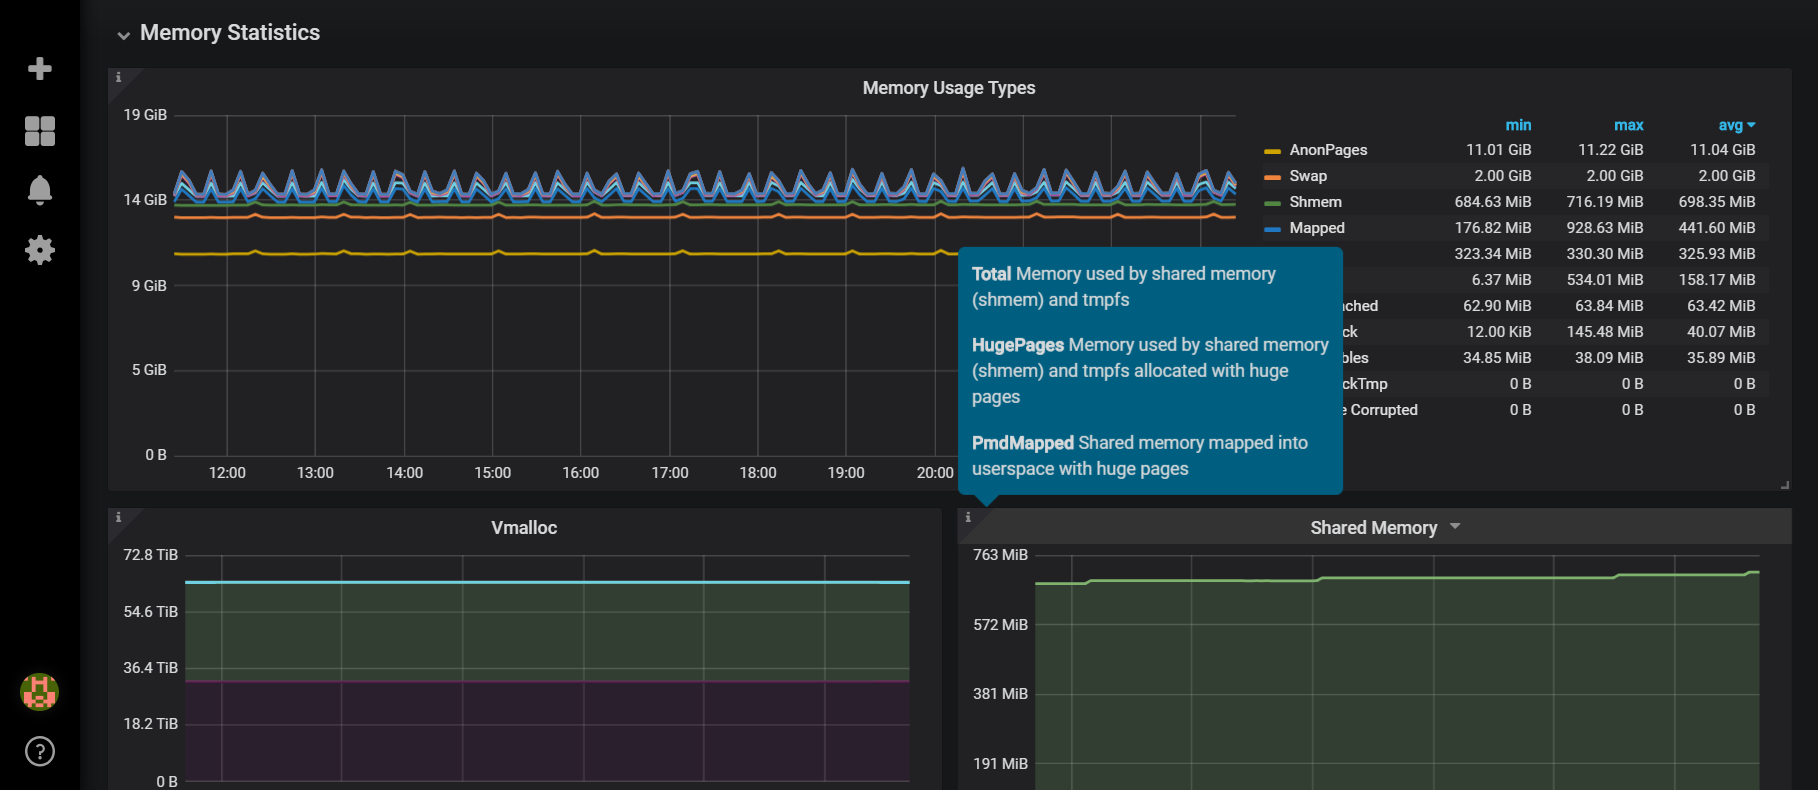
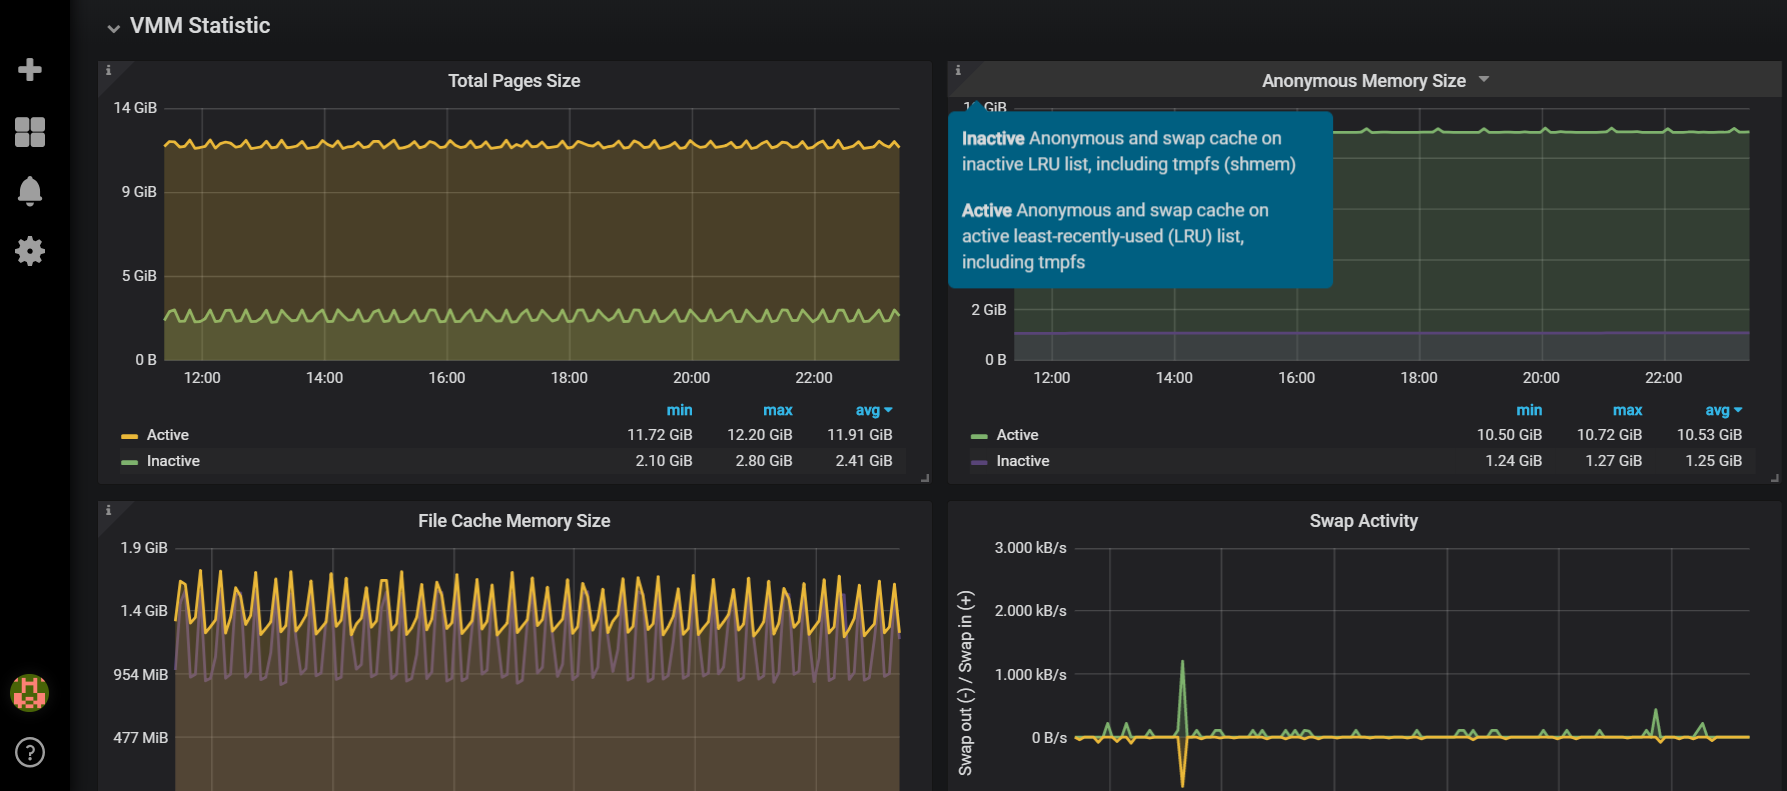
The dashboard that displays metrics related to memory usage on Linux systems.
Designed for https://www.percona.com/software/database-tools/percona-monitoring-and-management
Screenshots
Used Metrics 77
interval
node_memory_Buffers
node_memory_Cached
node_memory_MemFree
node_memory_MemTotal
node_memory_SwapFree
node_memory_SwapTotal
Get Dashboard✕
Download
Copy to Clipboard