Memcached Pods monitoring (via Prometheus) v1 1,7241,724
4/3/2024
4/3/2024
1
>=10.4.1
Prometheus
Description
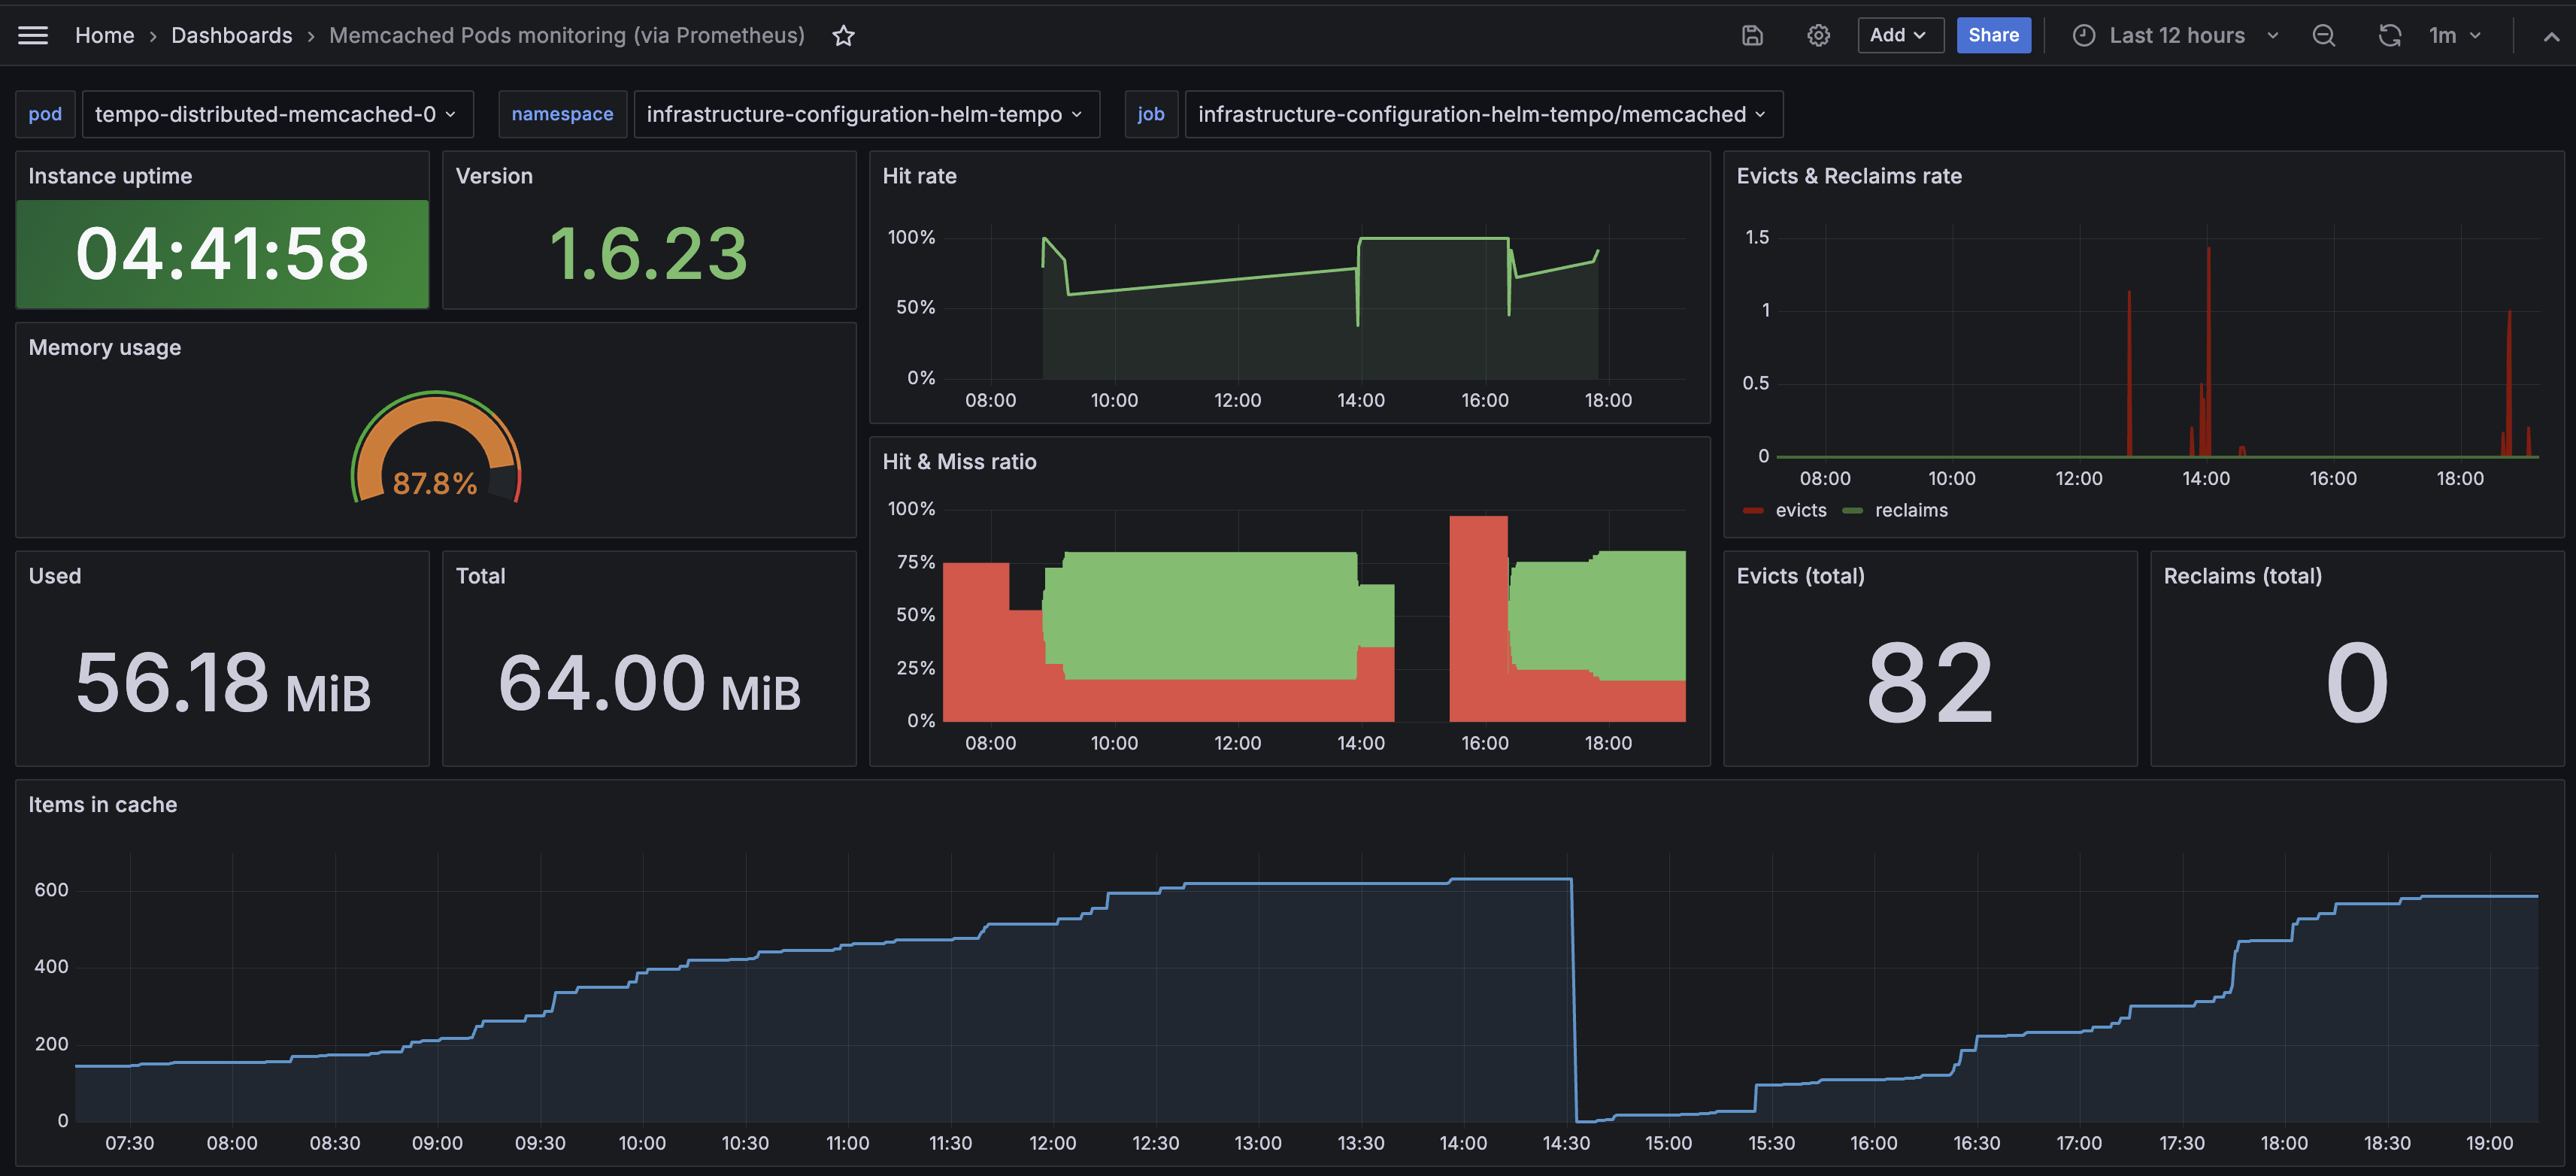
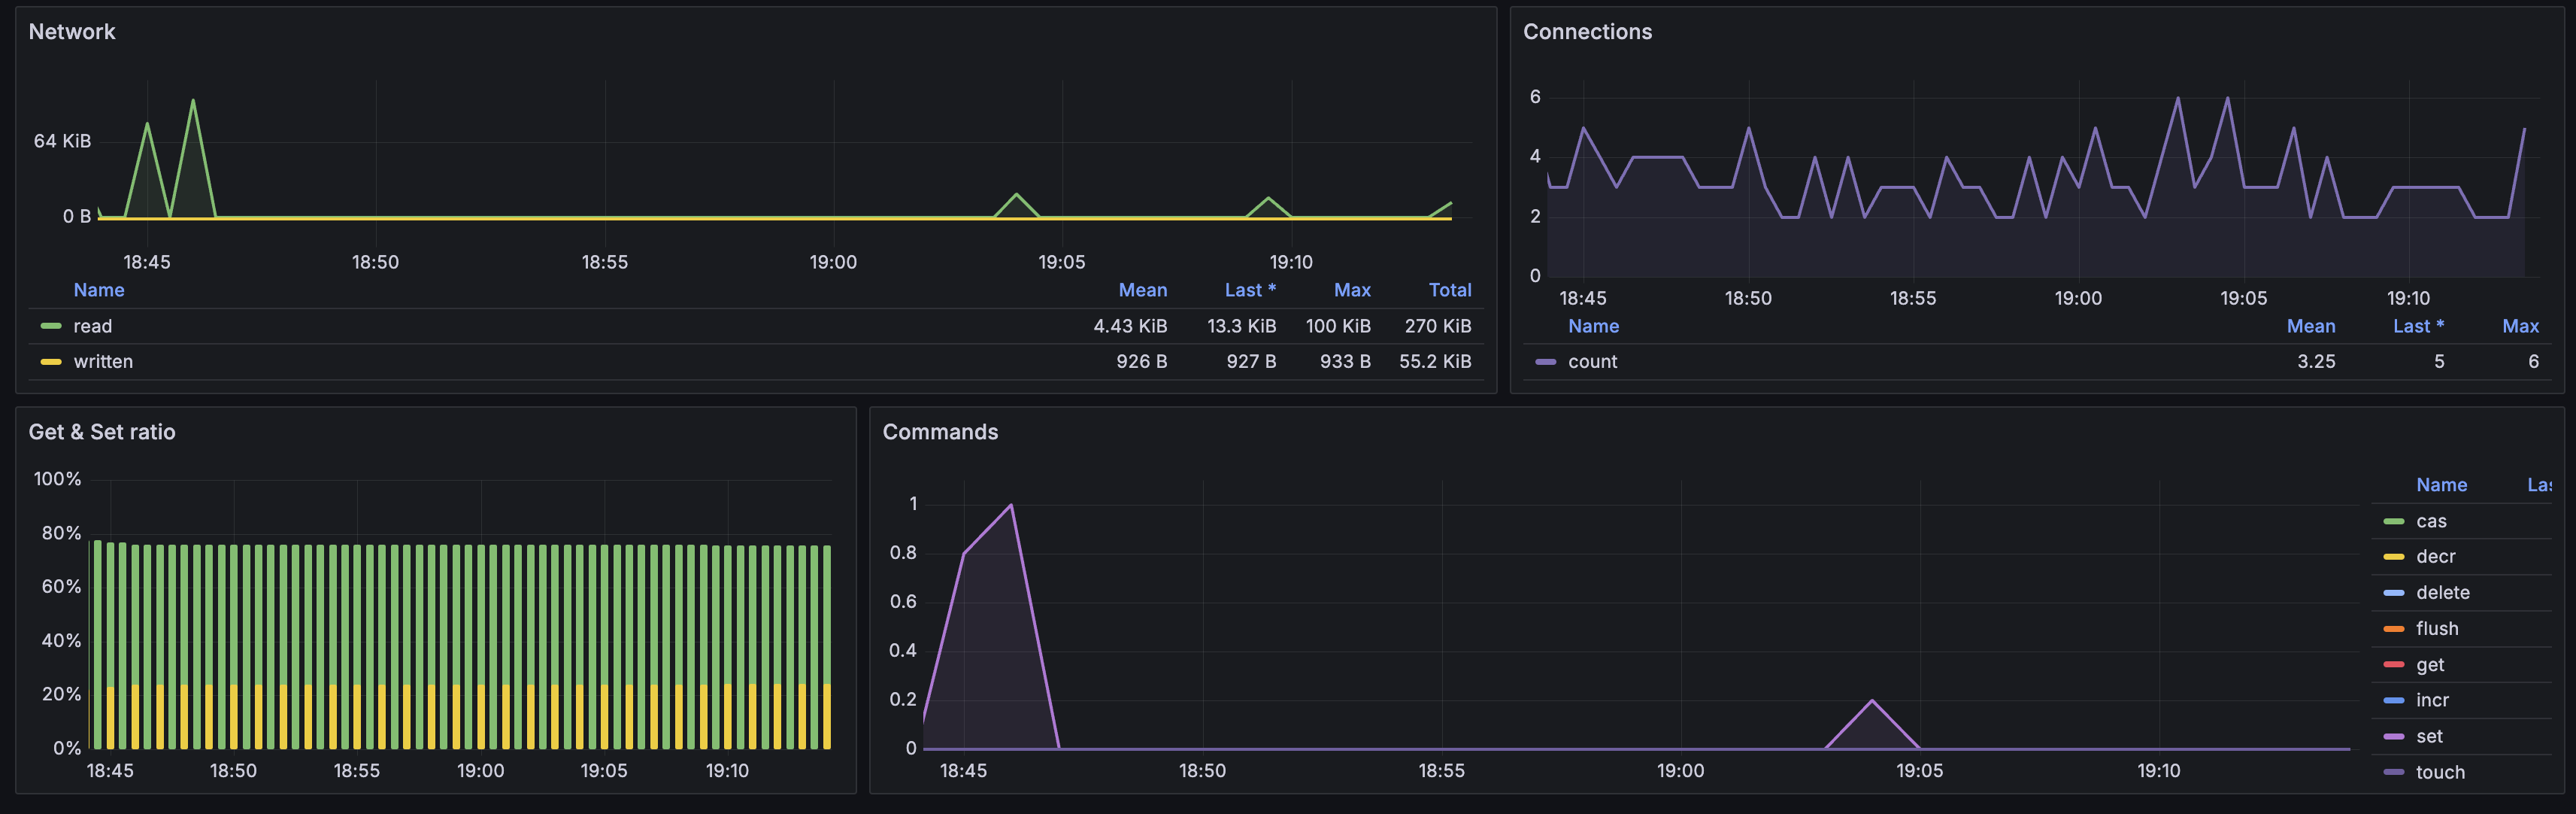
Monitors Kubernetes Memcached Pods. Shows memory usage, hit rate, evicts and reclaims rate, items in cache, network stats, commands rate. Requires Memcached Exporter for Prometheus.
Screenshots
Used Metrics 1212
memcached_commands_total
memcached_current_bytes
memcached_current_connections
memcached_current_items
memcached_items_evicted_total
memcached_items_reclaimed_total
memcached_limit_bytes
memcached_read_bytes_total
memcached_up
memcached_uptime_seconds
memcached_version
memcached_written_bytes_total
Get Dashboard✕
Download
Copy to Clipboard