Memcached Pods monitoring (via Prometheus) 10,924,88510,924,885 4.0 (1 reviews)
8/30/2017
8/30/2017
1
DatabasesDocker
>=4.4.3
Prometheus
Description
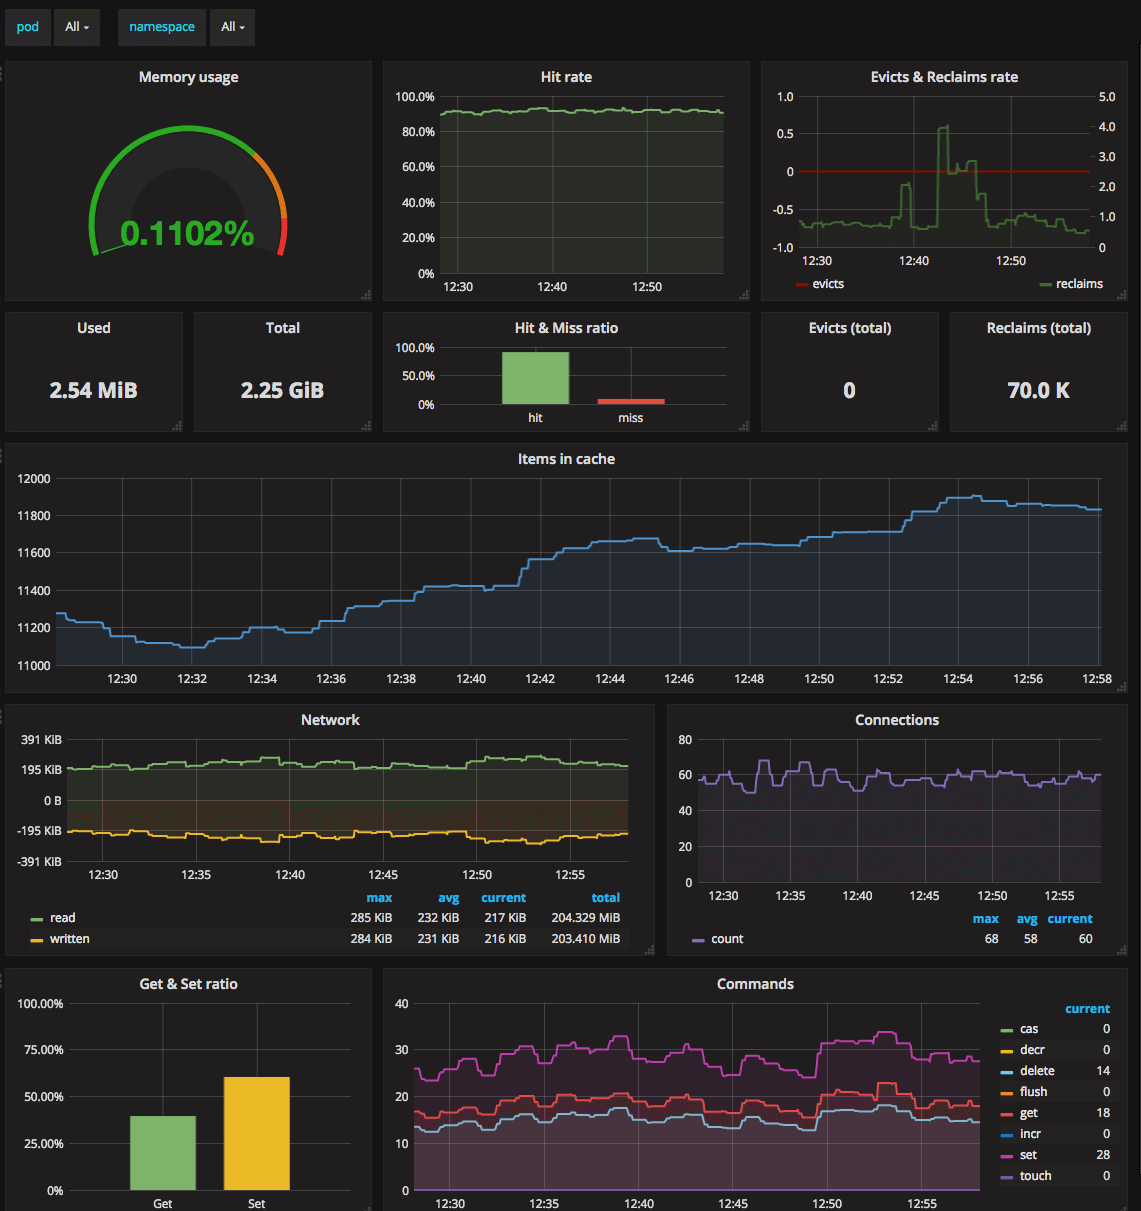
Monitors Memcached pods via Prometheus, focusing on performance, resource usage, and availability across the cluster. Key metrics typically include memcached_requests_per_second, memcached_cpu_seconds_total, and memcached_memory_usage_bytes to surface throughput, CPU utilization, and memory footprint per pod. The dashboard highlights health checks, pod-level alerts, and visualizes trends over time to quickly detect latency spikes, memory pressure, and uneven pod load.
Screenshots
Get Dashboard✕
Download
Copy to Clipboard