Memcached 1,1781,178
2/14/2024
2/14/2024
1
>=10.1.2
Prometheus
Description
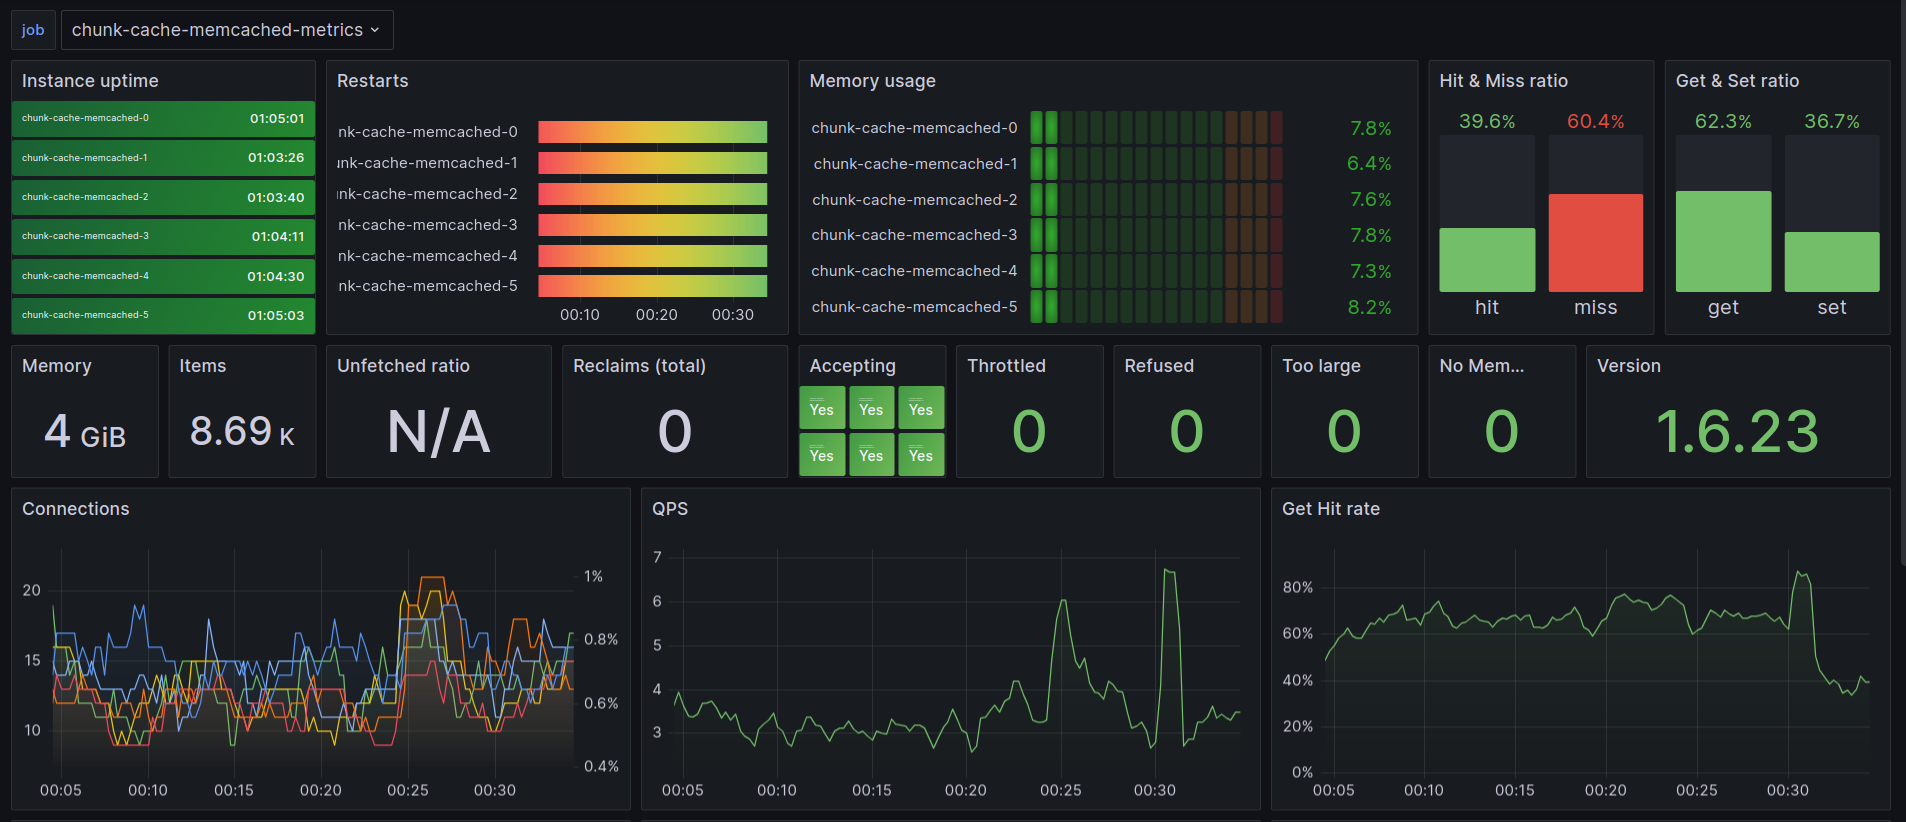
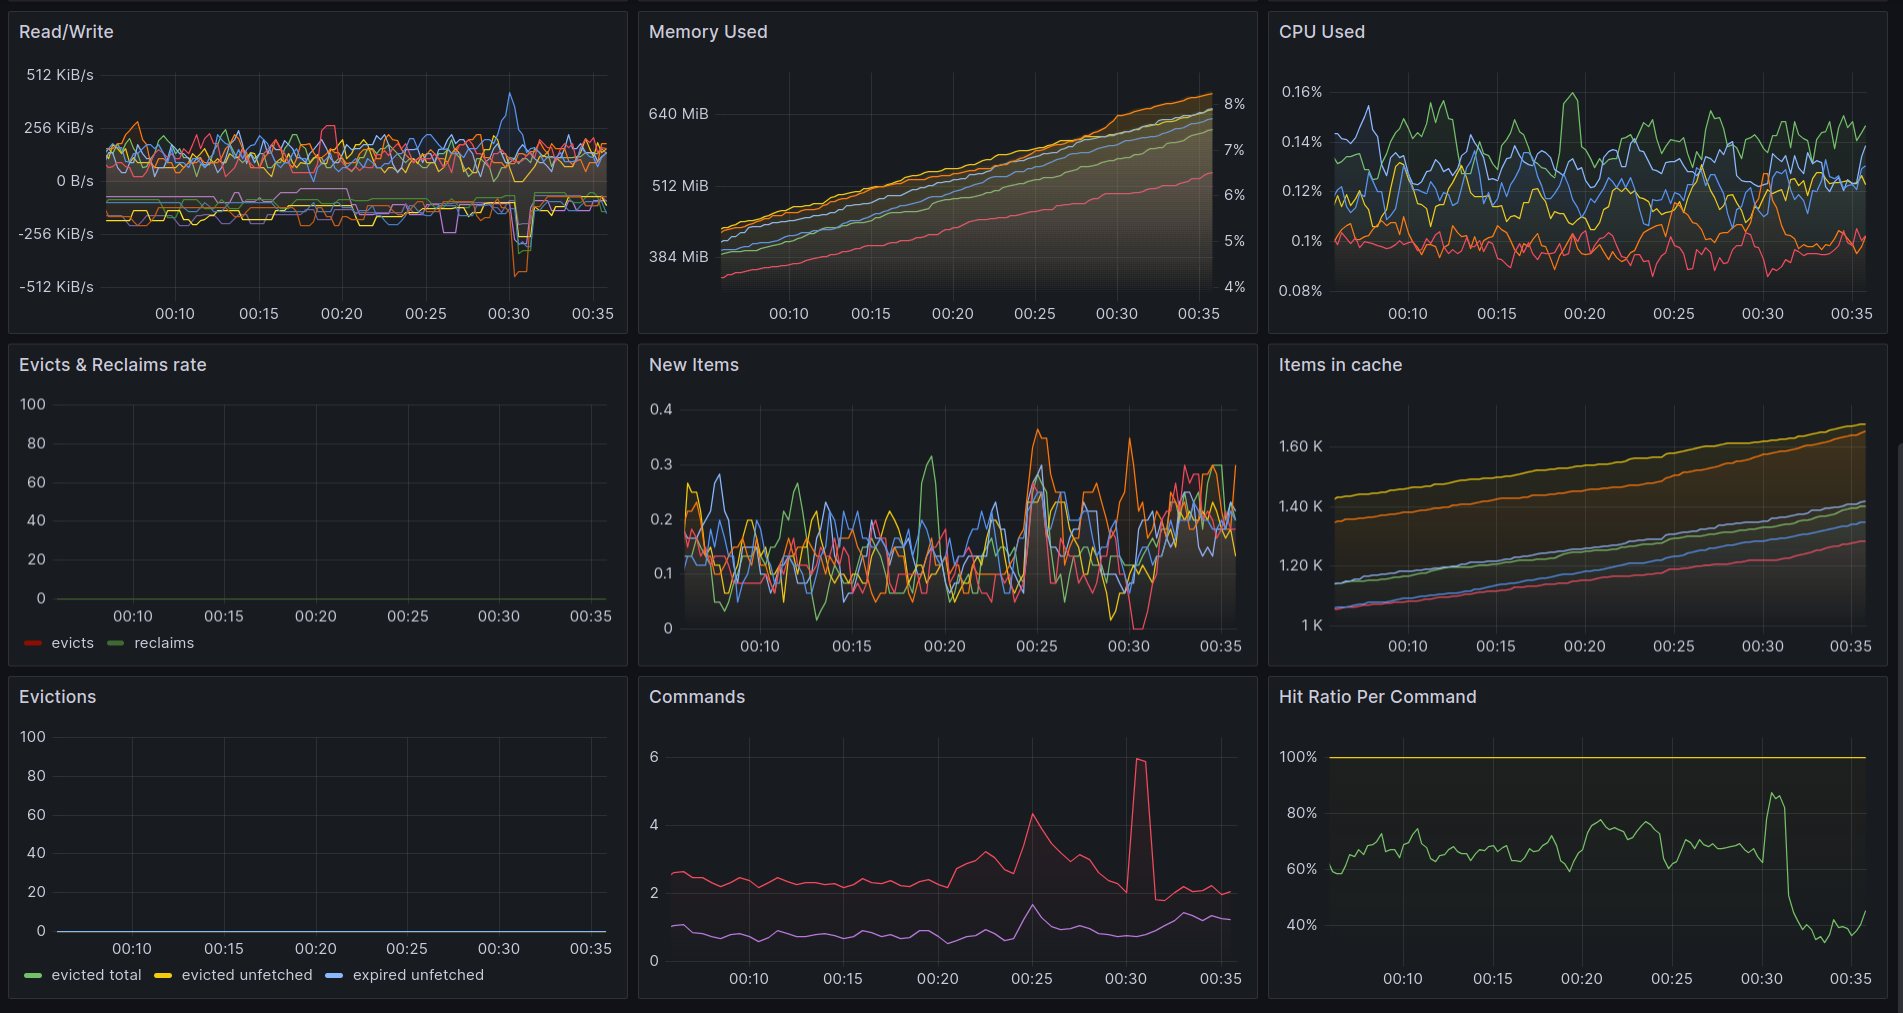
Visualize memcached-exporter metrics
Screenshots
Used Metrics 2222
any
memcached_accepting_connections
memcached_commands_total
memcached_connections_listener_disabled_total
memcached_connections_yielded_total
memcached_current_bytes
memcached_current_connections
memcached_current_items
memcached_item_no_memory_total
memcached_item_too_large_total
memcached_items_evicted_total
memcached_items_reclaimed_total
memcached_items_total
memcached_limit_bytes
memcached_max_connections
memcached_process_system_cpu_seconds_total
memcached_process_user_cpu_seconds_total
memcached_read_bytes_total
memcached_up
memcached_uptime_seconds
memcached_version
memcached_written_bytes_total
Get Dashboard✕
Download
Copy to Clipboard