Memcached 221,074221,074 5.0 (1 reviews)
Description
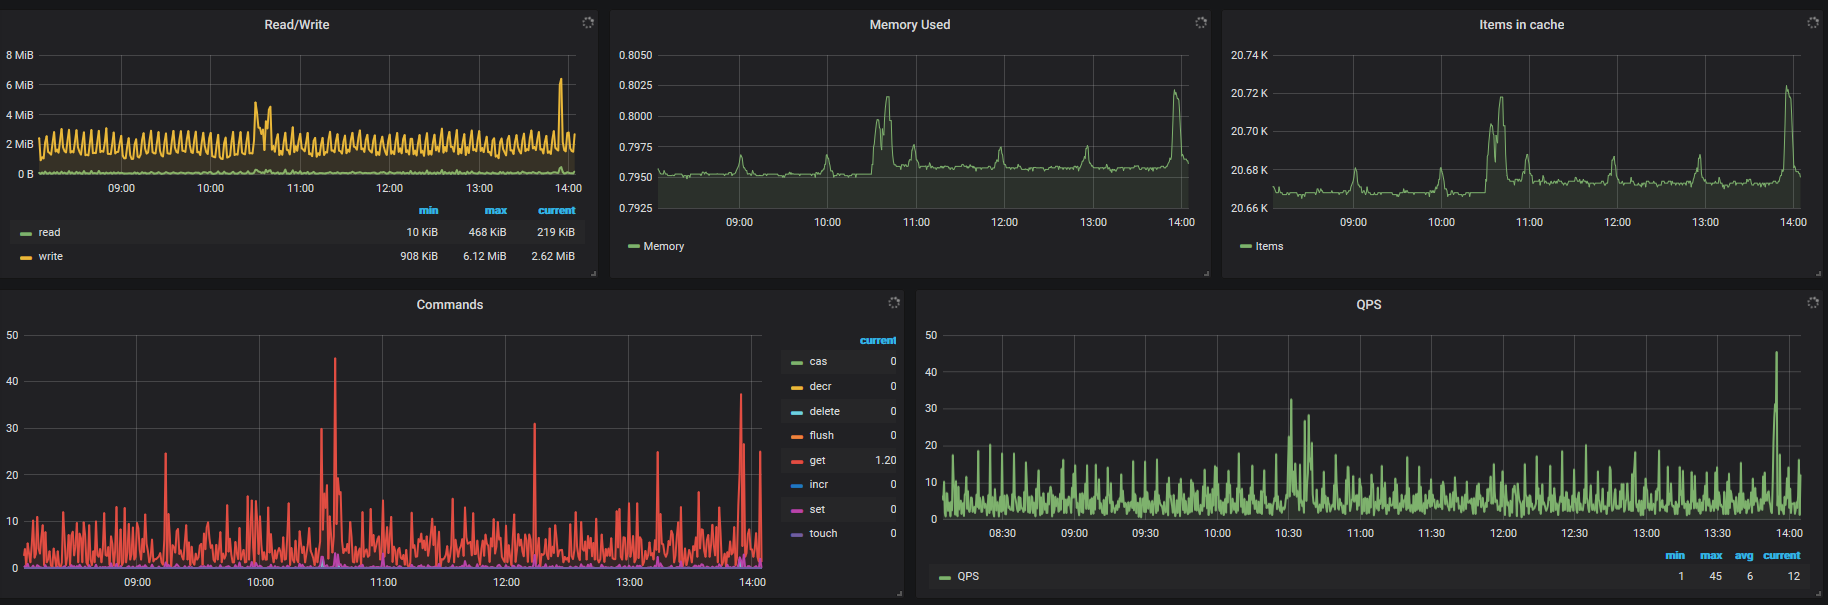
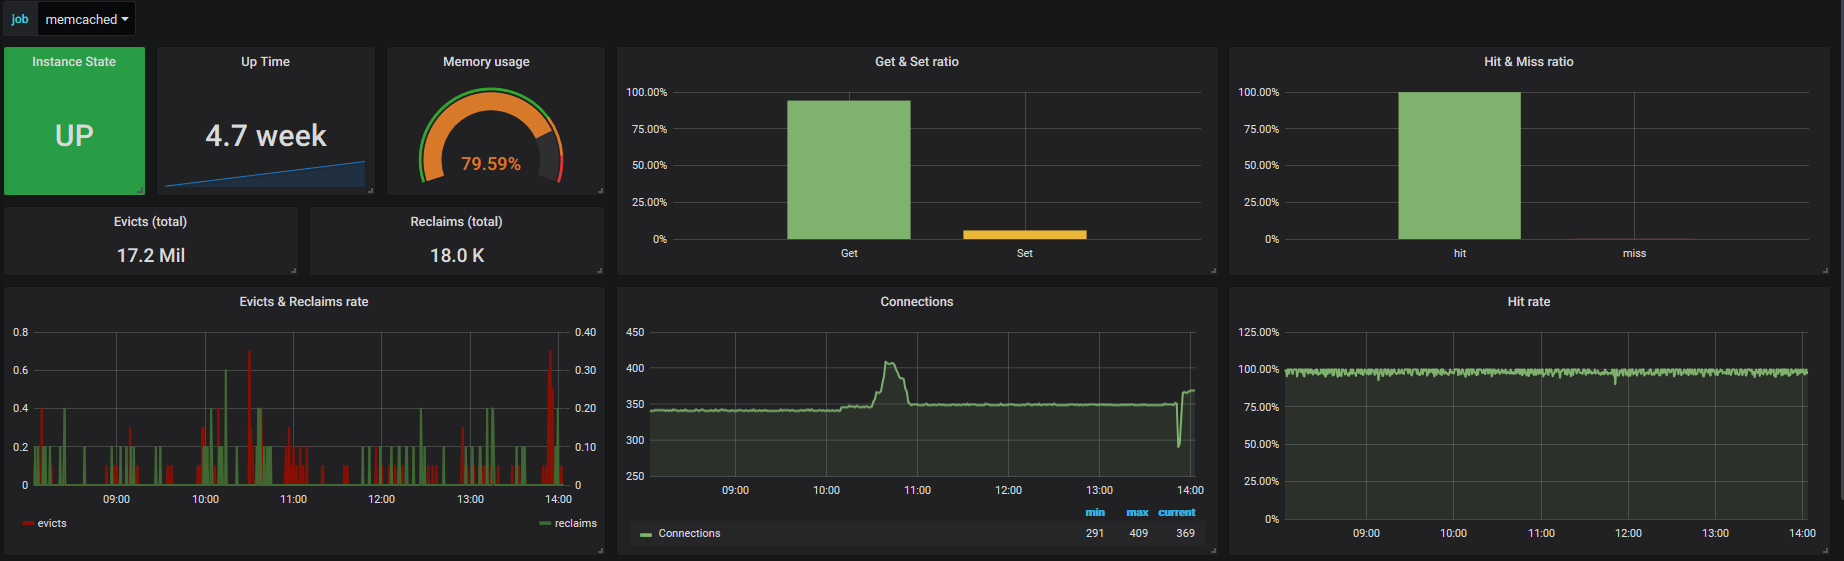
This dashboard monitors the health and performance of a Memcached deployment, with focus on availability, resource utilization, and request performance. It highlights uptime and instance state through memcached_up and memcached_uptime_seconds, memory footprint and limits via memcached_current_bytes and memcached_limit_bytes, and request throughput and ratio metrics such as memcached_commands_total, memcached_read_bytes_total, and memcached_written_bytes_total to assess hit/miss behavior and data transfer. It provides granular panels for evictions/reclaims, cache items, connections, and per-command hit ratios to pinpoint bottlenecks and cache effectiveness.
Screenshots
Used Metrics 1111
memcached_commands_total
memcached_current_bytes
memcached_current_connections
memcached_current_items
memcached_items_evicted_total
memcached_items_reclaimed_total
memcached_limit_bytes
memcached_read_bytes_total
memcached_up
memcached_uptime_seconds
memcached_written_bytes_total